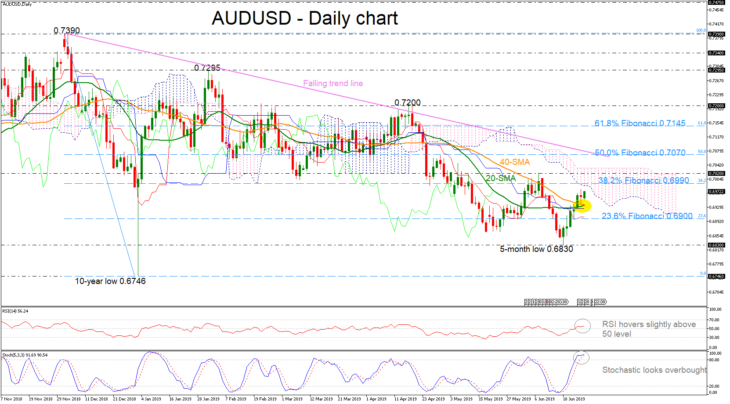
AUDUSD has been extending its gains since the previous week following the strong support on the five-month low near 0.6830. The pair surpassed above the 20- and 40-day simple moving averages (SMAs) which are ready to post a bullish crossover, signaling further upside momentum.

However, the stochastic oscillator seems to be losing momentum in the overbought territory, the RSI is still flattening slightly above the 50 level as well as the red Tenkan-sen and the blue Kijun-sen lines, all signaling a more cautious trading in the short term.
The pair needs to overcome the 38.2% Fibonacci retracement level of the downfall from 0.7390 to 0.6830 near 0.6990 to meet a key barrier around the 0.7020 resistance, taken from the latest high on June 7, near the upper surface of the Ichimoku cloud. The 50.0% Fibonacci mark of 0.7070 could act as resistance too as it overlaps with the falling trend line before a more important battle starts near the 61.8% Fibo of 0.7145.
On the flipside, if the price weakens below the SMAs, support to downside movements could be initially detected around the 23.6% Fibo of 0.6900. Clearing this zone, the next stop could be at the five-month low of 0.6830.
In the short-term picture, the sentiment turned slightly bullish after the price surpassed the 0.6900 number but the technical indicators are moving sideways expressing a possible downside trend again. Traders should wait for a jump above the six-month descending trend line before initiating positive positions.


 SP500
SP500 FTSE
FTSE FCE
FCE Nasdaq100
 Russell2000
 Index Nikkei225
 DOW 30 (DJI)
 RTS futures
 RTSI
RTSI DAX30
DAX30 eBay Inc.
 Google Inc.
 IBM Corp.
 Microsoft
  Apple
Apple Yandex
 Toyota
 Volkswagen
 Facebook
 Tesla
Tesla Twitter
 Hasbro
 Bitcoin
 Litecoin
 BitcoinCash
 Dash
Dash Ripple
 Ethereum
 EmerCoin
 NameCoin
 PeerCoin
 Monero
 ETC/USD
 Silver
 Platinum
 Palladium
 Copper
 Gold
Gold