Correction coming in US500 (S&P500) – The US’ decision to lift the currency manipulator label from China ahead of the signing of a Phase 1 trade deal may be taken by the market as risk-supportive. Meanwhile, the monitoring list comprised of Japan, Korea, Germany, Italy, Ireland, Singapore, Malaysia, and Vietnam, with the addition of China and Switzerland. The S&P500 rallied 0.7%, led by tech stocks on optimism about the Phase 1 trade deal signing and the upcoming earnings season, while UST bonds declined amid heavy issuance that took the 10- year bond yield up to 1.84%. There is also some market speculation that the Fed could hike the IOER at the 28 January FOMC meeting.
Asian markets traded in a mixed manner overnight on the news that China’s currency manipulator label will be removed by the US ahead of the signing of the Phase 1 trade deal. Economic releases due today comprise US’ NFIB small business optimism index and CPI, China’s December trade data and money aggregates. Apart from the US-China trade deal, the market would also likely focus on US bank earnings releases. Fed’s Williams and George, as well as ECB’s Mersch and Villeroy are also speaking.
Fed’s Bostic argued the Fed can “sit back” as the economy is “doing fine” and there is a “high bar” for any rate hikes until inflation is convincingly at the 2% inflation target. Meanwhile, Rosengren (dissenter for the three cuts in 2019) opined that he would be monitoring risks of higher inflation and financial instability and “if these risks remain contained, my view is we will likely have another year of good economic outcomes”.
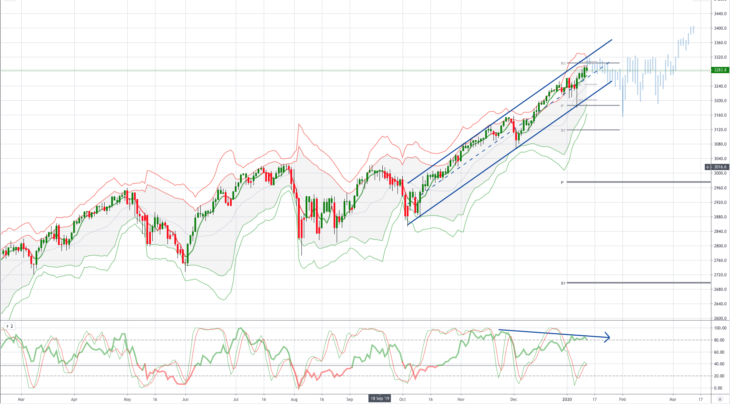
From a technical and trading perspective, the US500 is potentially setting up for a classic buy the rumour sell the fact trade. Technically there is decent overhead resistance provided by projected trendline resistance and pivot confluence (weekly and monthly R1 level) all in the 3300/3320 price bracket. Bears will be watching for daily reversal patterns to develop as we test this level, ideally post the signing of the Phase one trade deal Wednesday, setting the bull trap. A close on the day below the near term volume weighted average price, flipping the daily chart bearish would add conviction to the potential for a meaningful correction to develop, initially targeting a retest of ascending trendline support at 3245, the fourth test f this trendline should see follow through to the downside targeting the monthly pivot at 3190 and symmetry swing support inextension sited at 3160.
Disclaimer: The material provided is for information purposes only and should not be considered as investment advice. The views, information, or opinions expressed in the text belong solely to the author, and not to the author’s employer, organization, committee or other group or individual or company.

