Bearish USD Index – Global risk sentiment consolidated on Tuesday ahead of the signing of the phase one trade deal today. US markets were at first riding high due to positive Q4 earning results from major banks on the back of FICC trading performance. The party was disrupted halfway, however, as news that there will not be any further reduction in China tariffs until after the US election in November hit the wire. In addition, the decision to reduce the existing tariff will hinge on China’s compliance with the phase-one trade deal. The understanding gap between US and China on the rollback of existing tariffs is likely to be the source of volatility in future, as most Chinese officials believe that the existing tariff will be phased out gradually though there is no commitment from Trump Administration to reduce the tariff further.
On a positive note, the release of the breakdown of China’s US$200 billion agricultural purchase plan from the US over the next two years show that both sides are serious about reaching the trade truce. According to Reuters, China has pledged to purchase US$80 billion of additional manufacturing goods and US$50 billion more energy products. In addition, China will also increase its purchase of agriculture products by US$32 billion over the next two years as well as boosting purchase of US services by US$35 billion. This means China will need to purchase about US$40 billion US agriculture products per annum for the next two years. This looks more feasible as compared to the US$50 billion purchase as mentioned by President Trump previously, which will reduce the implementation risk.
US economy continues to show little signs of inflation. CPI rose by 2.3% YOY, slightly shy of market expectation of 2.4% while core CPI grew by 2.3%, intact from the reading in November. The cooling costs of used cars, airline tickets and household furnishing offset the rising healthcare costs. The latest inflation reading dampened any concern that the Fed might have to be forced to hike rates anytime soon. The New York Fed said it will continue to inject liquidity on repo offerings until at least mid-Feb. However, in Feb, it will reduce the cap for two weeks repo to US$30 billion from US$35 billion.
US Treasury yields led the global core yields lower on the day on the soft CPI print. Back-end rate differential advantage for the broad USD continues to be shaved off. A measure of 10y rate differentials between the USD and rest of the majors is back at levels last seen in Oct 2017, prior to the run higher in the USD Index. Long term correlation between rate differentials and the USD Index is also seen to be building. Expect this to translate to structural negative on the USD.
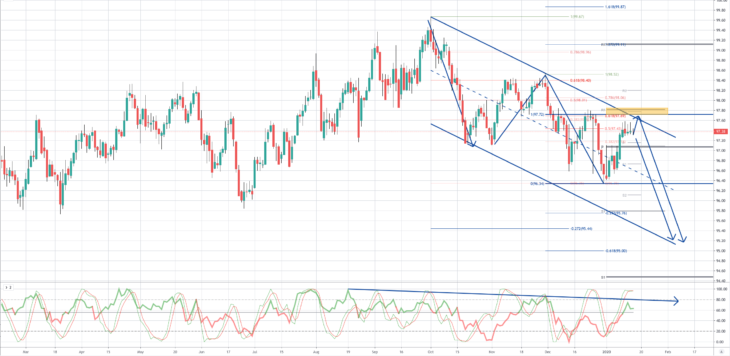
From a technical and trading perspective, the USD Index appears to be struggling in advance of some key resistance sited at 97.70/90 area. Note the repeated long tail candles over recent days. The potential price reversal zone (PPRZ) retains multiple Fibonacci retracements, symmetry swing, pivot confluence and trendline resistance. As the PPRZ rejects the current advance bears will look for aretest of prior cycle lows at 96.34 en-route to an ultimate equidistant swing objective sited towards 95.00, only a close above 98.10 would negate the downside thesis.
My perspective on the broad USD Index is a barometer and guide I use for positioning in FX Majors XXXUSD pairs. In coming charts of the day I will show how my Dollar view will underpin setups developing in EUR/GBP/AUD/NZD/CAD/CHF/JPY
Disclaimer: The material provided is for information purposes only and should not be considered as investment advice. The views, information, or opinions expressed in the text belong solely to the author, and not to the author’s employer, organization, committee or other group or individual or company.

