At the end of the month, oil prices are consolidating. On Monday, October 28th, 2019, Brent is trading at 61.57 USD, which is pretty good given quite an unpleasant month for the commodity market.
According to the latest report from Baker Hughes, the number of rigs in the USA lost 21 units over the previous week and now equals to 830. The components of the report show that oil rigs lost 17 units, while gas rigs decreased by 4. Overall, it’s the most significant decline of the indicator over two years and a half. Since January 2019, it dropped by 21%, although the extraction expanded by 7.7%.
The United States Department of Energy says that the current oil extraction is at 12.6M per day and it didn’t change over the past week. However, the EIA Crude Oil Stocks Change and the EIA Gasoline Stocks Change were -1.7M and -3.1M respectively.
This week, commodity investors’ attention will be focused on the US Federal Reserve meeting and US-China trade talks. In the case of optimistic decisions and outcomes, oil prices may grow a little.
Brent oil on charts
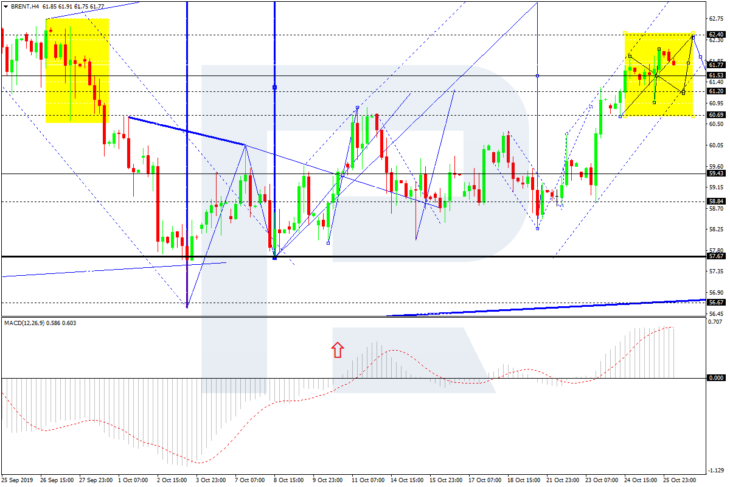
As we can see in the H4 chart, Brent has completed another ascending structure towards 61.30, which may be considered as the half of the third wave inside the uptrend; right now, it is consolidating to break 61.50 to the upside. Possibly, the pair may expand the range towards 62.40 and then start a new decline to return to 61.30. However, if the price breaks 62.40 upwards, the instrument may continue growing with the predicted target of the third ascending wave at 64.50. From the technical point of view, this scenario is confirmed by MACD Oscillator: its signal line is moving above 0 near the highs. The indicator suggests that the pair may start a correction. On the other hand, the dynamics of the current consolidation range imply further uptrend.
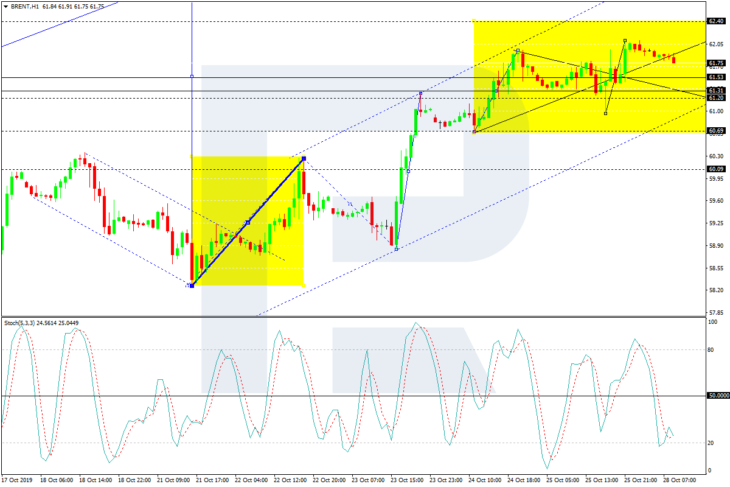
In the H1 chart, Brent is consolidating around 61.50. Possibly, today the pair may form a new descending structure to reach 61.50 or even 61.30. Later, the market may resume growing towards 62.40 and then start another decline to return to 61.50. In fact, these movements may be considered as parts of the upside continuation pattern. After finishing consolidating, the price may move upwards to break 62.40. From the technical point of view, this scenario is confirmed by Stochastic Oscillator: its signal line is moving near 20 and about to resume growing. Practically, the indicator suggests that the instrument is moving close at the bottom of the consolidation range. In the future, the line is expected to move to break 50 and then continue growing towards 80, thus boosting the uptrend.

