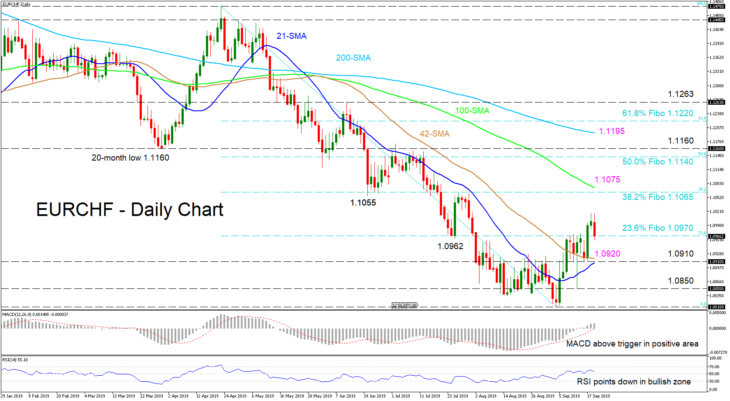
EURCHF bulls briefly overcame the formidable 1.0970 zone, which is the 23.6% Fibonacci retracement level of the down leg from 1.1475 to 1.0810, although the bears seized back control and are currently challenging that level. In recent weeks, the pair has been in recovery-mode, reclaiming some of the losses it posted during a nineteen-week decline that commenced on April 23.
The unfolding short-term positive outlook also seems to be backed by the 21- and 42-day simple moving averages (SMAs), as the 42-day SMA has flattened, with the 21-day SMA nearing a completion of a bullish cross. That said, short-term oscillators paint a mixed picture, as the RSI is pointing down while the MACD still suggests that upside momentum remains in play.
In a positive scenario, the price could rally further to the 38.2% Fibo of 1.1065, before the 100-day SMA at 1.1075. Climbing higher, the 50.0% Fibo of 1.1140 unfolds ahead of a nearby resistance at 1.1160. Logging more gains, the road would open towards the 200-day SMA around 1.1195.
If the bigger negative picture overwhelms and the bears push clearly below the 23.6% Fibo of 1.0970, the pair could encounter some interference around the more durable support region of 1.0910 – where the 21- and 42-day SMAs also lie. If the selling persists, the swing low of 1.0850 could apply pressure ahead of a revisit to the twenty-eight-month low of 1.0810 and before the focus shifts again to the gap of April 2017.
Overall, steering above 1.1065 could turn the short-term bias to bullish, while a shift back below 1.0810 would enhance the negative sentiment in the medium-term.

