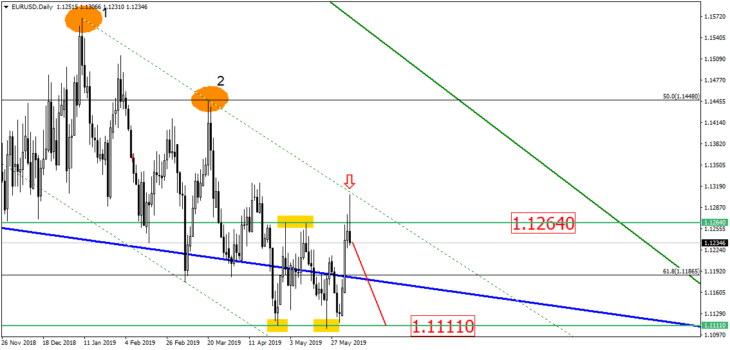
In the daily chart, the price of currency pair EUR/USD almost touched the downtrend and left a fine long shadow trying to close below the 1.1264 level. It has also formed a shooting star which is also a bearish engulfing pattern. The rates formed the range with important 1.1111 level serving as its opposite boundary. All in all, we assume that single currency should potentially drop anytime soon:
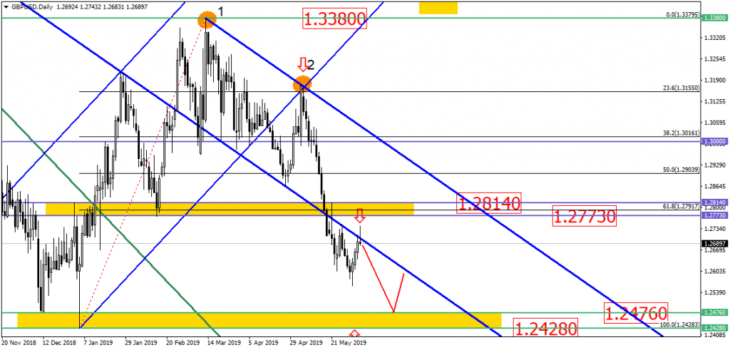
The British pound again approached the broken downtrend and is now trying to form a shooting star. Should the trading day close with this candle, the British pound will most likely drop and reach the support zone between the 1.2476 and 1.2480 levels:
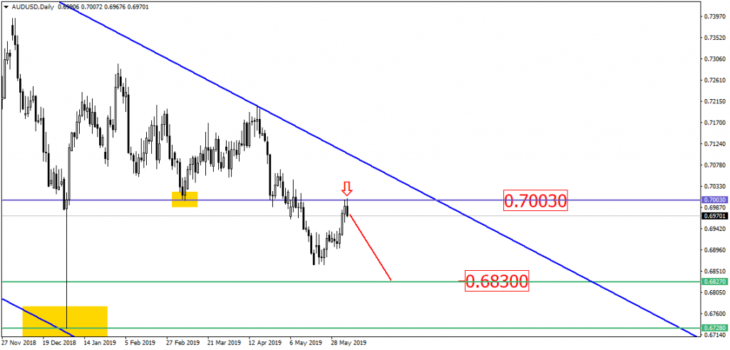
In the daily chart, Australian currency pulled back from the broken support level and psychological level of 0.7000, trying to close trading day with a bearish engulfing. Should this pattern finally form, the asset’s price can potentially drop targeting the level of about 0.6830:
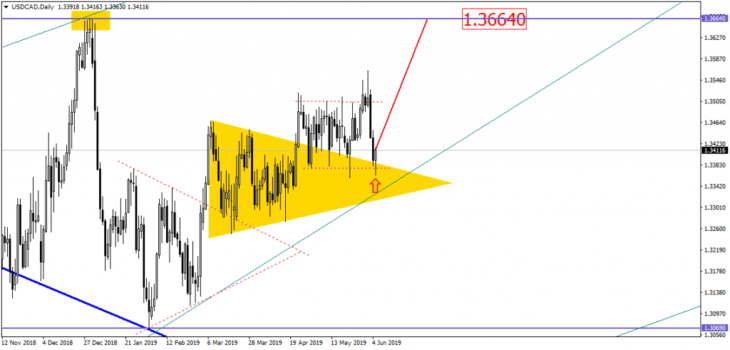
The Canadian dollar is testing the broken upper side of a symmetrical triangle for a fourth time in a row. It’s also strongly pulling away from the broken trendline. Now, the asset’s price is trying to form a bullish candle and jump again. We assume that in this case the asset will potentially target the 1.3664 level:
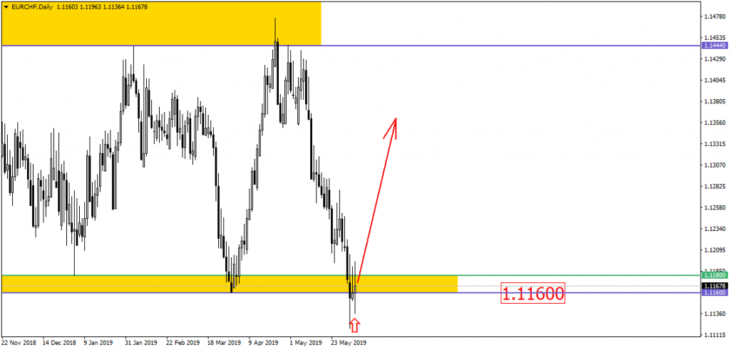
The cross rate of EUR/CHF tried to break the lower boundary of the large daily range but quickly got back into the flat, leaving a long shadow after a false breakout. Currently, the trading day might close with a pattern with white body and very long shadows along both sides of a so-called high-wave candlestick. This candle is located at the lower boundary of the flat or the 1.1160 level, which serves as a support. It signifies a potential trend reversal and jump: