EURUSD’s pullback from the 1.1238 top has again been interrupted by the 50-day simple moving average (SMA). That said, a bearish crossover of the Kijun-sen line by the falling Tenkan-sen line backs a negative view. The pair is currently flirting with a key support area around 1.1092 to 1.1082 involving the 50-day SMA and 38.2% Fibonacci retracement of the down leg from 1.1411 to 1.0878.
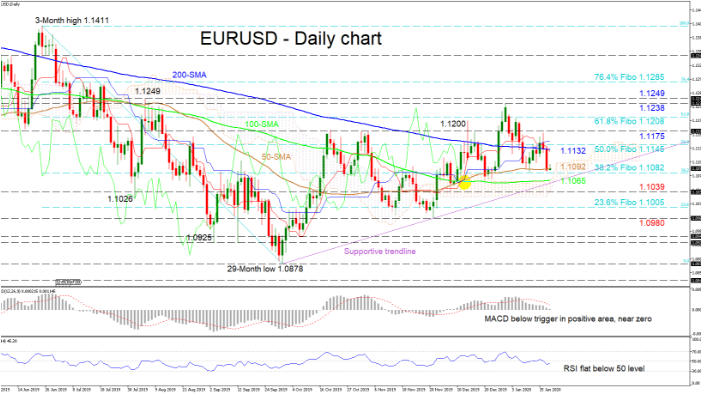
The short-term oscillators reflect a pause in the market but lean towards a negative picture. The MACD, in the positive zone, has declined below its red trigger line until the zero level, while the RSI is hovering underneath its neutral mark.
To the downside, managing to slip below the key area of 1.1092 to 1.1082, a more sustained push would be required to surpass another important barrier around the 1.1065 level, which is where the flat 100-day SMA has merged with the upper boundary of the Ichimoku cloud. Steering underneath the supportive trendline, the swing low of 1.1039 could prevent the drop towards the 23.6% Fibo of 1.1005 and trough of 1.0980.
If buyers pivot the price off the 50-day SMA at 1.1092, initial resistance could come from the 200-day SMA at 1.1132 and the nearby 50.0% Fibo of 1.1145. Next, the 1.1175 obstacle may apply some downside pressure as it is a level that has held several times in the past. Climbing higher, the 61.8% Fibo of 1.1208 could draw attention ahead of the 1.1238 and 1.1249 peaks.
Summarizing, the very short-term bias is neutral-to-bearish. As all SMA’s are mostly flat, the price may adopt a sideways move to test the supportive trendline before a clearer direction evolves.

