GBPJPY is still facing signs of a fading descending move as the RSI and the MACD keep moving higher, posting a positive divergence at a time when price seems to be edging lower in the daily timeframe. Currently, the pair is finding strong resistance at the red Tenkan-sen line of the Ichimoku cloud after it recorded a new six-month low of 133.80 on Thursday.
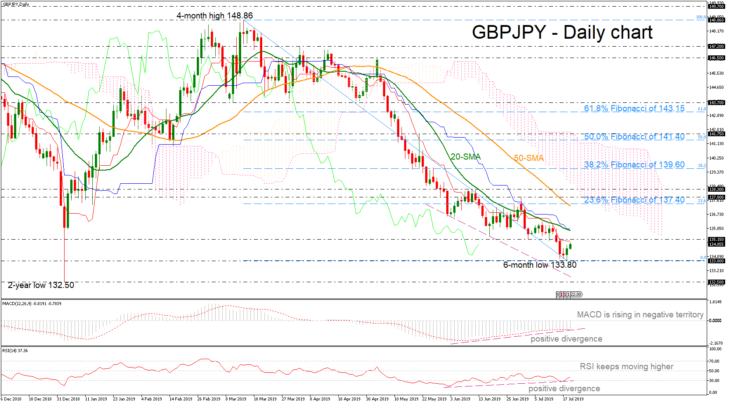
In case of an end of the bearish structure, the price needs to complete a strong upside rally until the 135.15 immediate resistance and the 20-day simple moving average (SMA) currently at 135.70. A run towards and above the 23.6% Fibonacci retracement level of the downward wave from 148.86 to 133.80 near 137.40, which coincides with the 50-SMA could open the door for a neutral bias around the 137.80 – 138.30 resistance zone. Positive momentum could come only if the price surpasses the Ichimoku cloud and the 61.8% Fibonacci of 143.15.
Should the market finish a day comfortably below the 133.80 region this could endorse the negative attitude again and prices could reach the two-year low of 132.50. A violation of this line would turn the spotlight to the 129.00 handle, taken from the inside swing top on November 2016.
Briefly, the technical indicators are suggesting the end of the downward move, though only a significant close above 143.15 could shift the negative status to positive.

