GBPUSD is lacking direction over the last five weeks, creating a symmetrical triangle in the short-term after reversing from the 14-month high of 1.3515. When looking at the bigger picture, the pair has a clear bullish trend since September 2019 but technical indicators are confirming the recent neutral mode. The RSI is declining slightly below the 50 neutral level, while the MACD oscillator is failing to strengthen its momentum near the zero line.
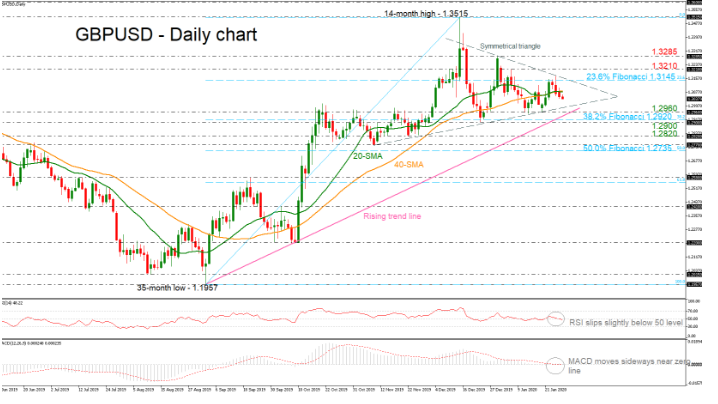
Currently, the price is hovering below the 20- and 40-simple moving averages (SMAs) and is heading towards the lower boundary of the triangle around the 1.3000 handle. Below that, a penetration of the triangle and the ascending trendline could also encounter some pressure at the 1.2960 support, before flirting with the 1.2920 obstacle, which is the 38.2% Fibonacci retracement of the upleg from 1.1957 to 1.3515, as well as the 1.2900 round number beneath. Clearing these key levels would see additional losses until the 1.2820 barrier, taken from the lows on November 22.
If the price remains above the rising trendline, then the focus would shift to the upside until the 23.6% Fibo of 1.3145, while if breached would increase upside pressure and drive the pair above the symmetrical pattern at towards 1.3210 and 1.3285.
Overall, GBPUSD would endorse its upside movement only if there is a daily close above the 1.3210 resistance barrier.

