Gold managed to test 1500.00 USD, the highest price over the last 6 years. Despite the fact that the instrument rebounded from the highs a little bit and right now is forming a correction, a lot of experts believe that the bullish rally in Gold may continue. From the technical point of view, Gold has been rising rather aggressively and has already successfully broken several ascending channels to the upside – as a rule, this signal shows the strength of bulls. Global political and economic instability forced market players to invest both in Bitcoin and precious metals
The reason for this may be a series of rate cuts by leading Central banks. Moreover, investors are expecting the ECB to cut the rate as early as in September this year.
Another thing that is pushing Gold upwards is continuing US-China trade wars. The USA announced that they hadn’t yet agreed on the decision to allow some American companies to continue cooperating with Huawei Technologies. In exchange, China stopped importing all agricultural products from the USA, as a countermeasure. Earlier, Trump had announced 10% tariffs on additional 300 billion USD on a Chinese import.
Apparently, trade tensions might as well continue, thus supporting the rallying rate of Gold and making investors be more aggressive in opening long positions in the precious metal.
Gold – technical analysis
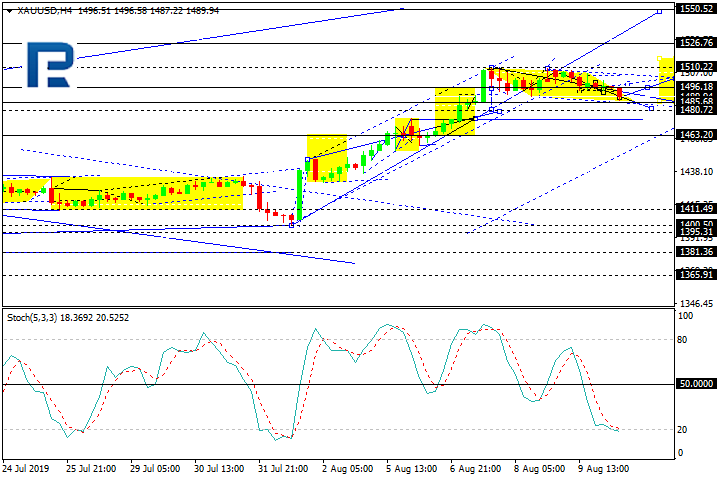
In the H4 chart, XAUUSD is forming a correction towards 1484.50. Later, the market may form one more ascending structure to reach 1496.20 and then fall to complete the correction at 1480.80. After that, the instrument may resume trading upwards with the target at 1550.00. From the technical point of view, this scenario is confirmed by Stochastic Oscillator, as its signal is moving below 50 and may continue trading to enter the “oversold area”, thus indicating further decline of the price to reach 1484.50. After leaving the area, the signal line may move towards 50 to show the ascending structure with the target at 1496.20. Still, this scenario may no longer be valid if the line breaks 50 to the upside and continues growing steadily.
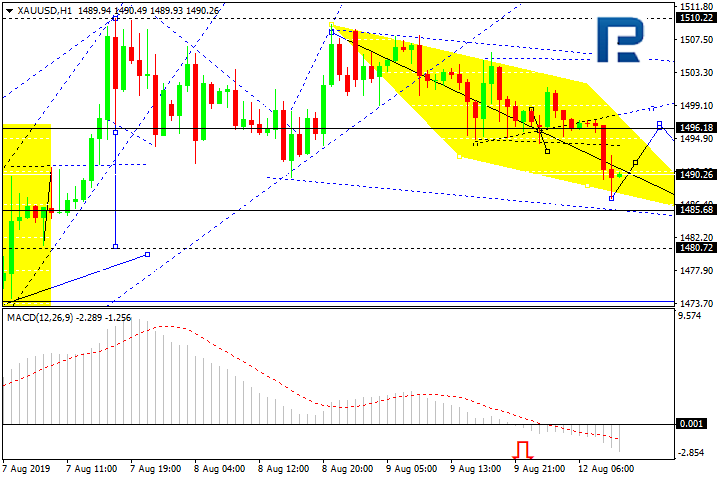
As we can see in the H1 chart, XAUUSD has broken 1496.20 to the downside and may fall with the short-term target at 1484.50. Later, the market may return to 1496.20 and then form a new descending structure to reach 1480.80. From the technical point of view, this scenario is confirmed by MACD Oscillator, as its signal line is moving below 0, thus indicating further decline towards 1480.80. However, this scenario may be canceled if the signal line steadily moves upwards. After the line breaks 50, the instrument may continue growing to reach 1496.20.

