Gold continued to trade along the downward-sloping trend-line following the negative breakout of an ascending channel, despite closing neutral last week.
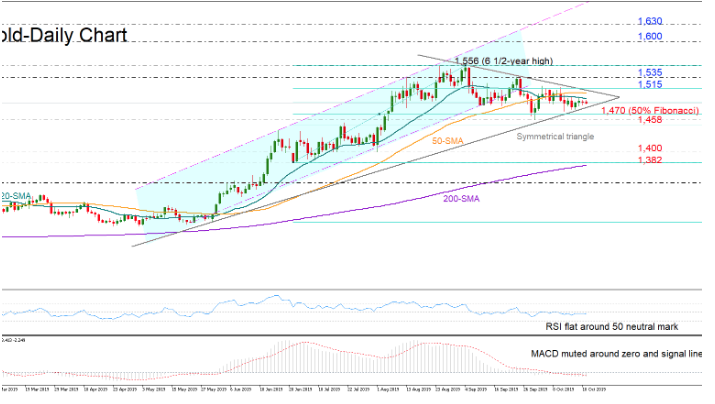
Traders may maintain neutral behavior in the short-term according to the flattening RSI and MACD, probably keeping the market below the descending trend-line as the bearish crossover between the 20- and 50-day simple moving averages suggests.
However, questions are rising about whether the bears are strong enough to violate the new support line drawn from May’s troughs that looks to be part of a symmetrical triangle.
Should gold close under the lower line of the triangle and more importantly below the 1,470-14,58 region, encapsulated by the 50% Fibonacci of the upleg from 1,382 to 1,556 (July 1 -September 4) and the previous low, the door would open for the 1,400-1,380 support area.
Alternatively, a rally above the resistance line and the 23.6% Fibonacci of 1,515 could initially stall near the previous high of 1,535 before aiming for the 6 1/2 -year high of 1,556. Higher, the 1,600-1,630 zone could also restrict upside movements, though the main target could now be the resistance line that connects the previous tops.
In the medium-term picture, gold continues to point upwards as long as it trades above 1,382.
Summarizing, the short-term bias is viewed as neutral-to-bearish, though the price seems to be fulfilling a symmetrical triangle and any breakout could determine the next direction in the market.

