Gold printed a multi-year high of 1452.87 on July 19, but sellers moved the asset back below previous highs of 1433.50 and 1439 recorded a month ago. The metal has found support on the 21-day simple moving average (SMA) and the Kijun-sen average around 1415.
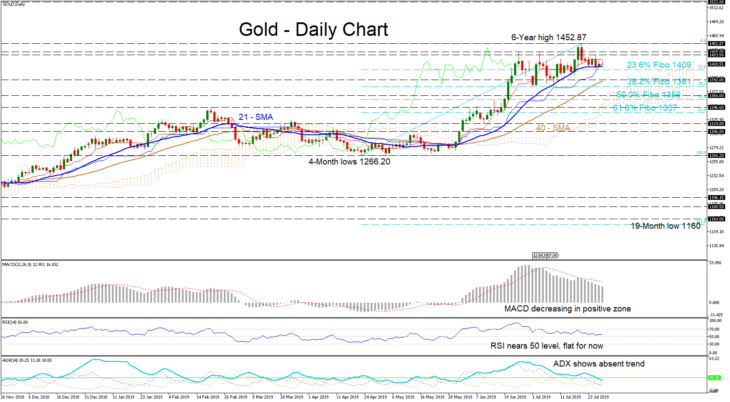
Tenkan-sen average has flattened out, indicating that short-term upside momentum is fading. The RSI agrees with this outlook, as despite being in positive zone, it has neared the neutral area and become flat. The MACD is decreasing below its trigger line, above zero. The ADX suggests no clear trending structure.
To the upside, a hold of the 21-day SMA and near the 23.6% Fibo of 1409, of the up-leg from 1266.20 to 1452.87, could see the price advance through previous peaks to revisit the high of 1452.87. Violating the high could bring awareness for another run upwards to 1522, a high from December 2011.
A downwards scenario, could see the price initially encounter the 20-SMA next to the 23.6% Fibo of 1409. Further down could see the support of 1392 of March 2014 coupled with the 40-day SMA be tested, followed by the 38.2% Fibo of 1381 which coincides with the previous swing lows.
Summarizing, gold is bullish in the medium- and long-term, but a short-term sideways move between 1380 and 1440 could continue for a while.

