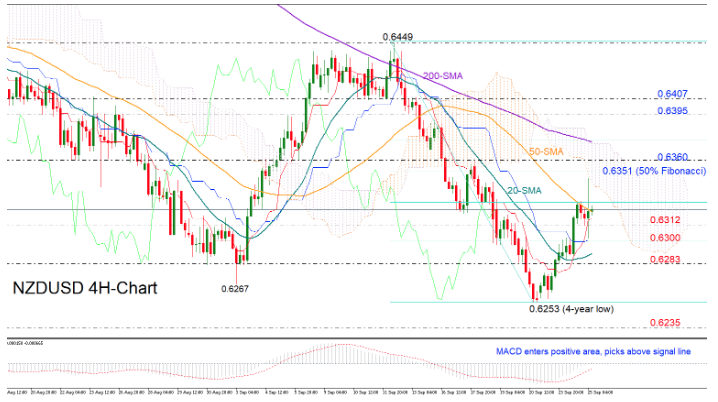
NZDUSD spiked above the 50-period simple moving average (SMA) in the four-hour chart but the bottom of the Ichimoku cloud proved tough to pierce, with the price pulling back.

Technically, there might be some bullish momentum in store as the MACD tries to make its way up in the positive region and higher than its signal line, while the red Tenkan-sen continues to point upwards above the blue Kijun-sen.
Traders, however, would like to see a closing price above the previous high of 0.6360, which is slightly above the 50% Fibonacci of the downleg from 0.6449 to 0.6253, before scrapping the downward pattern from the 0.6449 top. Moving higher, a rally above the 200-period SMA, which currently coincides with the upper surface of the cloud and the 61.8% Fibonacci of 0.6375, could add extra buying confidence, probably pushing resistance up to the 0.6395-0.6407 area.
Alternatively, a decline under 0.6312 could initially retest the 23.6% Fibonacci of 0.6300 and then challenge the 0.6283 barrier. If the latter proves easy to to get through, all attention will shift to the 4-year low of 0.6253, where any significant violation could bring the 0.6235 former support level into view.
In the bigger picture, the bearish outlook is still intact given the overall downward move in the market. The negative slope in the 50-period SMA, which deviates below the 200-period SMA, is another discouraging sign for those who expect an outlook reversal.
Summarizing, NZDUSD could look for more gains in the short-term, though only a climb above 0.6360 could add buying confidence to the market. In a longer-term time-frame the pair is expected to maintain the bearish outlook.


 SP500
SP500 FTSE
FTSE FCE
FCE Nasdaq100
 Russell2000
 Index Nikkei225
 DOW 30 (DJI)
 RTS futures
 RTSI
RTSI DAX30
DAX30 eBay Inc.
 Google Inc.
 IBM Corp.
 Microsoft
  Apple
Apple Yandex
 Toyota
 Volkswagen
 Facebook
 Tesla
Tesla Twitter
 Hasbro
 Bitcoin
 Litecoin
 BitcoinCash
 Dash
Dash Ripple
 Ethereum
 EmerCoin
 NameCoin
 PeerCoin
 Monero
 ETC/USD
 Silver
 Platinum
 Palladium
 Copper
 Gold
Gold