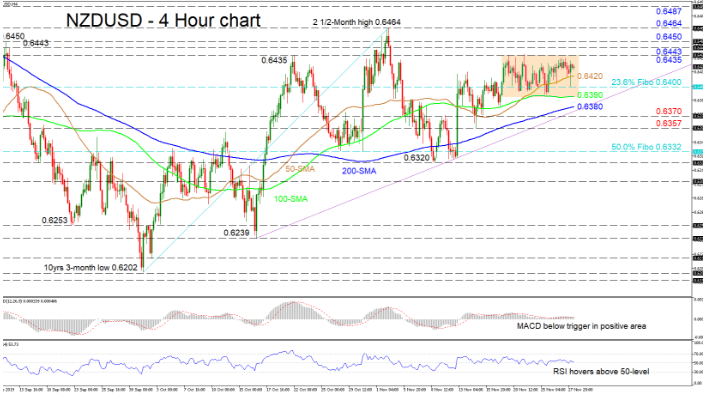
NZDUSD has found support from the 0.6400 level, which is the 23.6% Fibonacci retracement of the up leg from 0.6202 to 0.6464, sustaining the current sideways move between 0.6435 and 0.6390.
The short-term oscillators suggest that positive momentum has dried up, something also backed by the flattened 100-period simple moving average (SMA). The MACD is hovering just below its red trigger line, though it remains above zero, as is the RSI, which lies marginally above its neutral mark. However, the bullish sentiment is still intact as reflected by the 50- and 200-period SMAs.
If buyers manage to push higher, they would initially encounter a congested region of resistance obstacles from 0.6435 to 0.6450, being the peaks from September and October. Overcoming this barrier, the two-and-a-half-month high of 0.6464 may challenge the bulls before the focus turns to the 0.6487 resistance.
Alternatively, if sellers steer below the 50-period SMA at 0.6420 and the 0.6400 hurdle, the 100-period SMA at 0.6390 could halt further declines towards the 200-period SMA at 0.6380. Slightly underneath, the 0.6370 support could test the drop ahead of the swing low of 0.6357 from November 14.
Overall, the short-term bias is neutral-to-bullish and a break above 0.6435 or below 0.6390 would suggest the next direction. However, a shift below the 50.0% Fibo of 0.6332 and the trough of 0.6320 could throw into question the bigger positive picture.

