NZDUSD successfully surpassed the long-term 200-day simple moving average (SMA), gaining some ground and is holding near the three-month high of 0.6745 that it posted on Wednesday. The double bottom formation that was created around the 0.6480 – 0.6490 support levels with a neckline at the 0.6725 barrier, was completed with today’s break to the upside.
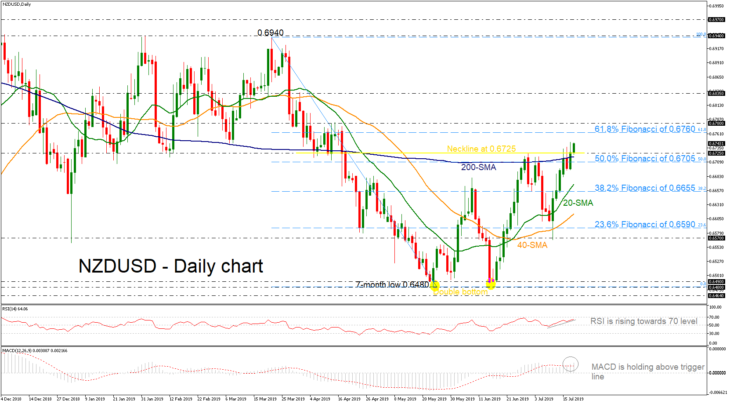
From the technical point of view, the Relative Strength Index (RSI) is rising in the positive territory, approaching the overbought zone, while the MACD oscillator is extending its bullish momentum above trigger and zero lines, confirming the recent bullish action on price.
Should the price edges higher, the 0.6760 resistance – which is the 61.8% Fibonacci retracement level of the downfall from 0.6940 to 0.6480 – could attract traders’ attention before touching the 0.6780 barrier. In case of an attempt above this hurdle, the short-term negative bias would switch to neutral, testing the 0.6835 resistance.
In the alternative scenario, a tumble back below 0.6725 and the 50.0% Fibonacci mark of 0.6705 could open the door for a rest near the 20-day SMA currently at 0.6670 and the 38.2% Fibonacci of 0.6655. More losses could be faced around the 40-SMA at 0.6615.
Overall, NZDUSD is in process to change the outlook from negative to positive but first it needs to violate the 61.8% Fibo and 0.6780 levels.

