Early in the last week of July, Oil prices are trading inside a narrow range close to 63 USD. In the mid-term, Brent is moving inside the range between 62 and 64 USD per barrel and there are no serious drivers so far that can make the instrument break the range to the side.
According to the latest data, the total number of rigs in the USA decreased by 8 units over a week by July 26th and now equals to 946. The number of oil rigs lost 3 units (776). Both indicator have been declining for the fourth consecutive week. Those market players, who invested a lot of money in the sector earlier and believed in the “shale gale”, now want to return their investments through reducing expenditures by oil producers.
Against this background, companies are forced not only to shut down their rigs, but also do some downsizing and clear special-purpose equipment. So far, it is happening in North America, but may spread around the globe later.
In theory, this should have boosted Oil prices, but right now investors can’t be sure of anything.
Brent – H4 & H1
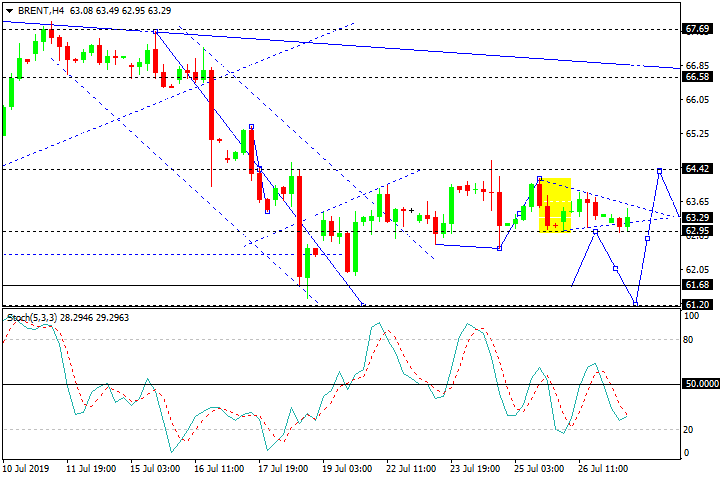
In the H4 chart, Brent is consolidating above 62.95. If the price breaks this range to the downside, the instrument may continue the correction towards 61.20 and then resume growing to return to 62.95. Later, the market may fall to reach 60.90 and then form one more ascending structure with the target at 66.60. However, this scenario may no longer be valid if the price breaks 64.50, in this case, the pair may directly trade towards 66.60. From the technical point of view, this scenario is confirmed by Stochastic Oscillator, as its signal is quickly trading below 50.00, indicating a decline towards 61.20. Still, this scenario may be cancelled if the signal line breaks 50.00. After that, the instrument may choose an alternative scenario and grow towards 66.60.
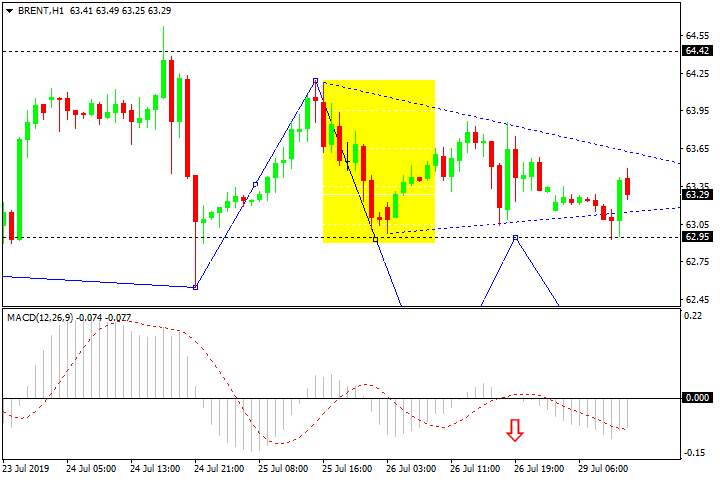
As we can see in the H4 chart, Brent is consolidating above 62.95. If the price breaks this level to the downside, the instrument may fall towards 61.70. Later, the market may grow to reach 62.95 and then form a new descending structure with the short-term target at 61.20. However, this scenario may no longer be valid if the price grows to break 64.50. In this case, the pair may choose an alternative scenario and grow towards 66.60. From the technical point of view, this scenario is confirmed by MACD Oscillator, as its signal line is moving below 0, indicating a decline towards the short-term target at 61.70. Still, this scenario may be cancelled if the signal line grows to break 0. After that, the instrument may move according to an alternative scenario to reach 66.60.

