The oil market is quite stable at the end of another August week. It is still balancing around 58.70 USD.
According to the Baker Hughes Oil Rig Count report from U.S. Energy Information Administration, the number of rigs in the USA added 1 unit and now is equal to 935 units. Over the year, the indicator has lost 122 units, 107 of which are oil rigs. We remind you that the peak of November 2018 was 888 units, while the all-time high was in 2014, 1,609 units.
Last week’s numbers say that oil extraction in the USA remains close to highs at about 12.2 million barrels per day. Daily production quickly recovered after the hurricane that took place earlier, which is a good signal.
It’s quite interesting that investors were pretty indifferent to the news relating to attacks on oil extraction facilities in Shaybah, Saudi Arabia. Responsibility for drone attack was claimed by rebels from Yemen. Attacks resulted in a small-scale fire, which was quickly put out.
Brent – H4 & H1
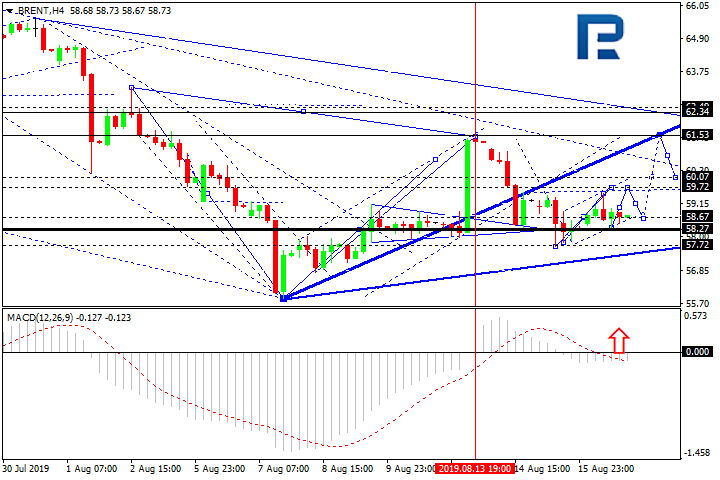
On H4, BRENT has completed an impulse of growth to 61.50 and a correction to the centre of the impulse of 58.27. As the main scenario, we shall regard the possibility of another impulse of growth forming in order to continue the wave to 62.35. Upon breaking this level upwards a potential for the continuation of the third wave to 61.17 may appear. The goal is local. The scenario may no longer be valid if the price nears 56.80. Then another decline to 55.90.
Technically, the scenario is confirmed by the MACD oscillator. Its signal line is escaping the histogram area, which suggests further growth, aimed at a breakaway of 0 upwards. Then a potential for accelerated growth to 62.35 may appear.
On H1, BRENT has broken through the correction channel and is trading in another impulse of growth to 59.70. It may then decline to 58.65 and grow to 60.00. Upon breaking this level upwards, a potential for growth to 61.60 may appear. The goal is local in the wave structure along the uptrend.
Technically, the scenario is confirmed by the Stochastic oscillator as well. Its strong signal line has broken through 50 upwards, which suggests further growth of the indicator to the overbought area.

