The US 500 stock index (cash) is recording its fifth week of gains within an ascending channel.
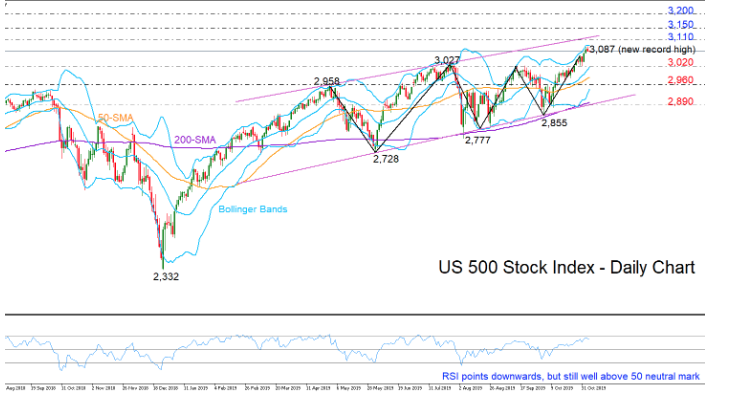
Having reached a fresh record high of 3,087, the market may experience some weakness in the short-term as the price touches the upper Bollinger band and the RSI reverses lower just below its 70 overbought mark. Yet, with the latter holding well above its 50 neutral mark and the market trend showing no signs of reversing as the index keeps printing higher lows and higher highs, the bulls are likely to dominate medium-term.
Immediate support to downside corrections could be the area around 3,020 where the bullish action topped twice from July onwards. Crossing under the middle Bollinger band, the former barrier of 2,960 could take control before the way opens towards the bottom of the channel and the 200-day simple moving average (SMA) currently around 2,890.
On the flip side, a resumption of the bullish momentum could test the upper surface of the channel currently seen around 3,110. Interestingly, if buyers manage to clear that obstacle, the next stop could be somewhere between 3,150 and 3,200; levels that hold psychological significance as the index is moving in uncharted territory.
Looking at the three-month picture (medium-term), the index is back on a positive track following the close above the 3,027 level, with the upward-sloping SMAs endorsing the bullish sentiment.
In short, the US500 stock index could face some downside pressure in the near-term but overall the market is expected to hold its upside direction, with the upper line of the ascending channel coming into focus.

