USDCAD has come under renewed selling pressure following the bounce off the 1.3430 resistance level and the 40-simple moving average (SMA). Despite the latest pullback though, the pair continues to post fresh lows, hitting a seven-month trough around 1.3035.
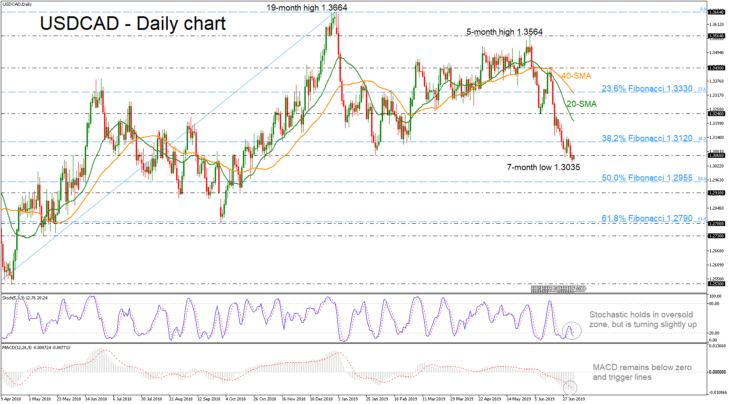
Looking at momentum oscillators on the daily chart though, they suggest further declines may be on the cards in the short-term. The stochastic is still developing in the oversold territory but it seems ready to turn higher, suggesting an overstretched market. The MACD remains in the negative zone below trigger and zero lines but it is weakening its momentum.
Should prices decline further, immediate support could be found around the 50.0% Fibonacci retracement level of the upleg from 1.2250 to 1.3664 near 1.2955. Then a leg below that level, the pair could meet the 1.2910 support, taken from the low on October 2018, before the focus shifts to the 61.8% Fibonacci of 1.2790.
However, if the market manages to pick up speed and surpass the 1.3065 immediate resistance, the 38.2% Fibo of 1.3120 could offer nearby obstacle ahead of the 20-SMA currently at 1.3207. A significant close above the latter would push the price until the 1.3240 barrier, identified by the inside swing bottom on June 10.
In the short-term, the bias remains negative since the price holds well below the moving averages, but in the bigger view USDCAD is still developing in an ascending movement. If there is a drop beneath the 61.8% Fibonacci, this would shift the outlook to bearish.

