USDCAD is testing the upward-sloping trendline drawn from the 3-month low of 1.3041 in the four-hour chart following Thursday’s pullback from the 1.3269 high.
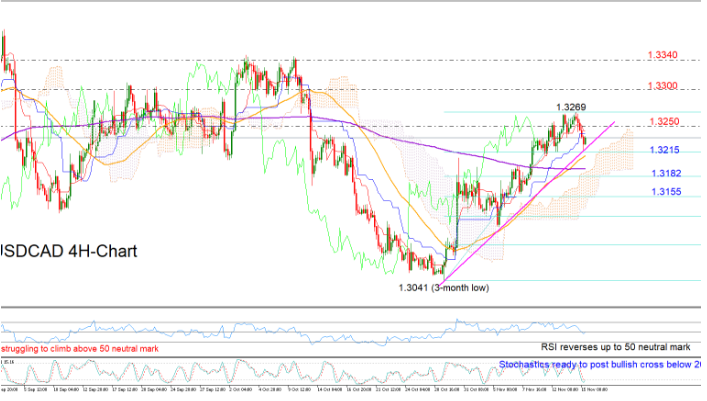
According to the fast Stochastics the odds for a rebound are increasing as the indicator is preparing to post a bullish cross below its 20 oversold mark. The RSI, however, is still around its 50 neutral mark and the red Tenkan-sen and Blue Kijun-sen lines look to be converging on the downside, signaling that any market action in the short-term could lack momentum.
An upside correction may initially fade near the former 1.3250 barrier before the focus turns to the 1.3269 peak. Should the pair close decisively above the latter, the door would open for the 1.3300 restrictive level, a break of which could send resistance up to the 1.3340 barrier.
On the downside, the area between the ascending trendline and the 23.6% Fibonacci of 1.3215 of the upleg from 1.3041 to 1.3269, is expected to curb any negative correction. If not, then the 38.2% Fibonacci of 1.3182 could come in defense, while lower traders could question the strength of the market’s recent upward pattern, reducing their exposures as the pair moves towards the 50% Fibonacci of 1.3155.
In brief, USDCAD is expected to consolidate in the short-term, with the focus remaining on the ascending trendline for any steeper move in the price.

