USDCAD seems to be on track to reach a significant support structure, despite its overall neutral picture reflected in the flat 200- and 100-day simple moving averages (SMAs), which are not giving any obvious direction.
The short-term oscillators reflect the stall in negative directional momentum. The MACD in the negative region has flattened below its red trigger line, while the RSI is rising in bearish territory. However, the ADX continues to indicate that a strong negative trend is in place.
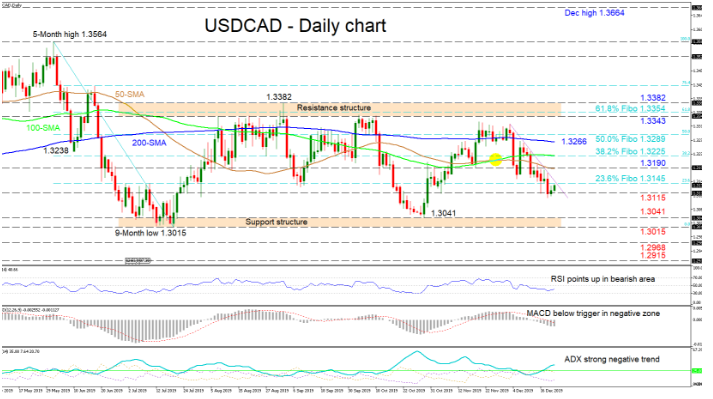
If sellers resurface and manage to dive below the 1.3115 obstacle, the more important support structure beneath of 1.3041 to 1.3015 could prove a tougher hurdle to penetrate. Steering underneath this area could see the 1.2968 and 1.2915 swing lows from October 2018 draw traders’ attention.
To the upside, an immediate encounter of the restrictive trendline drawn from the December 3 peak and 1.3145 resistance – which is the 23.6% Fibonacci retracement of the down leg from 1.3564 to 1.3015 – may challenge the bulls. Overtaking this, the 1.3190 barrier coupled with the dipping 50-day SMA could prevent the price from reaching the 38.2% Fibo of 1.3225, where the 100-day SMA also lies. Surpassing this too, the 200-day SMA at 1.3266 and nearby 50.0% Fibo of 1.3289 may impede the climb from stretching to the resistance structure of 1.3343 to 1.3382, which also encompasses the 61.8% Fibo of 1.3354.
Summarizing, the short-term bias is bearish below the restricting trendline, while the medium-term is still neutral confined between 1.3382 and 1.3015. A break-out of these limits would reveal the forthcoming direction.

