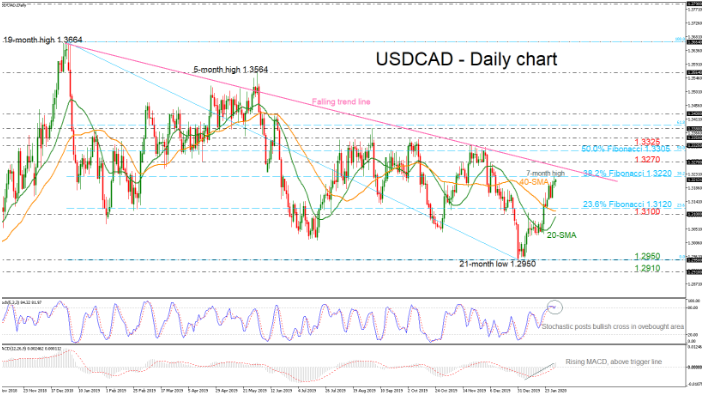
USDCAD is trading not too far from yesterday’s seven week high of 1.3220, which is the 38.2% Fibonacci retracement level of the down leg from 1.3664 to 1.2950. The bullish correction, which initially pivoted off the 21-month low of 1.2950, is approaching the one-year downtrend line.
The technical indicators are confirming the positive structure on price. The stochastic oscillator is posting a bullish crossover within the %K and %D lines in the overbought zone. The MACD is strengthening its upside momentum above its trigger and zero lines, giving signals for more gains.
A potential jump above the 38.2% Fibo could find nearby resistance at the descending trend line near 1.3255. A successful climb above this strong line would open the way for the 1.3270 resistance and the 50.0% Fibonacci of 1.3305, switching the long-term bearish view to neutral.
If the positive move fails to hold and price deflects off the trend line and reverses lower, the 23.6% Fiboof 1.3120 and the 1.3100 handle could come in focus. Within this area the 40-day simple moving average (SMA) is a strong support level before the price touches the 20-day SMA at 1.3093. More downside pressure could hit the 1.2950 support barrier.
All in all, in the very short-term, USDCAD has been in an upside tendency this month but the diagonal line may be a level to halt the gains.

