USDCAD continues the strong sell-off over the last six days, hitting a new 21-month low of 1.2950, at the end of last year. After the bearish cross within the 20- and 40-simple moving averages (SMAs), the price started a downside rally, falling below the 1.3015 – 1.3040 key area.
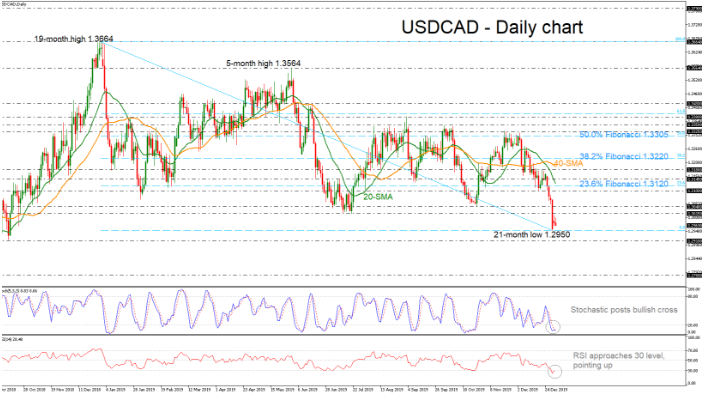
However, from a technical viewpoint, the stochastic oscillator is ready to create a bullish crossover within the %K and %D lines in the oversold zone, suggesting a pause of the negative movement on price. Also, the RSI is pointing up, touching the 30 level, indicating a possible upside correction as well.
Should prices reverse higher, immediate resistance could come at 1.3015 and at 1.3040 taken from the lows on July 19 and October 29 respectively. A move higher could open the door for the psychological mark of 1.3100 and the 23.6% Fibonacci retracement level of the downward wave of 1.3664 and 1.2950, around 1.3120.
On the other side, further losses, below the 21-month bottom of 1.2950, should see the October 2018 low of 1.2910. A drop below this line would reinforce the bearish structure in the medium-term and move towards the next key support of 1.2780, taken from the trough on September 2018.
Overall, in all timeframes USDCAD seems to be negative, despite the latest view of the technical indicators that the bearish bias is weakening.

