USDCAD is testing a long-term support trendline drawn from the 2017 trough after repeatedly failing to beat the tough wall around 1.3340. The bearish bias is still intact given the falling MACD and the negative direction in the RSI and therefore additional downside corrections are possible.
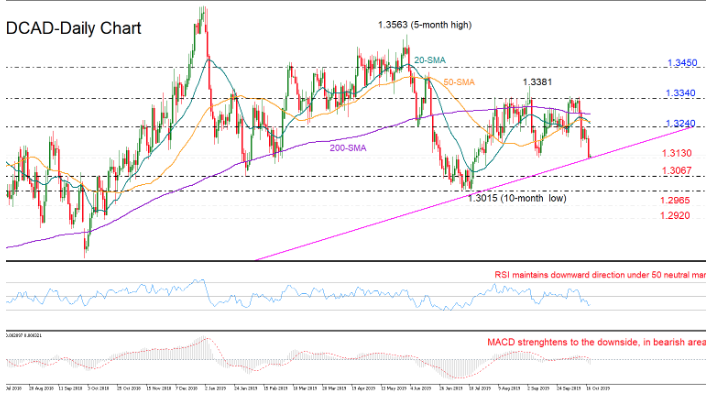
Yet, in case the bearish action proves too weak to break under the support trend-line, the market could stage a rebound towards the 1.3240 resistance before retesting the 1.3340 obstacle if it manages to surpass the 200-day simple moving average (SMA) too. Should the bulls reclaim 1.3340, piercing the previous high of 1.3381 as well, the way would open towards the 1.3450 obstacle.
Below the support line and the 1.3130 barrier, the sell-off could initially stall near 1.3067 and then around the 10-month low of 1.3015. Beneath the latter, the bears could meet the 1.2960 handle ahead of the 1.2920 mark, painting a bearish picture for the medium-term timeframe.
Summarizing, USDCAD continues to face downside pressure according to the technical indicators. However, questions remain about whether sellers can breach the long-term support trendline.

