USDCAD stretched this week’s decline until the 61.8% Fibonacci of 1.3150 of the upleg from 1.3041 to 1.3326 despite the declining risk-off sentiment.
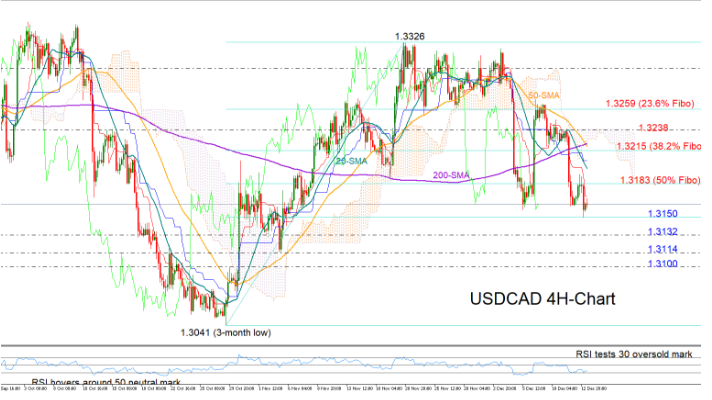
With the RSI testing its 30 oversold mark, the odds for an upside correction in the short-term are rising. However, with the 20-period simple moving average (SMA) in the four-hour chart crossing below the longer-term 200-period SMA, a trend improvement may come later than sooner, especially as the price keeps erasing its uptrend off 1.3041. Note that the 50- and the 200-period SMA are also ready to complete a bearish cross, providing additional negative signals for the market direction.
The 50% Fibonacci of 1.3183 could react as resistance in case of an upward movement as it did in previous sessions. If not and the market closes decisively above that level, the next target could be the 38.2% Fibonacci of 1.3215. Crawling higher, the bulls would try to return above the Ichimoku cloud which currently lays around the 1.3238 level and run towards the previous peaks near the 23.6% Fibonacci of 1.3259.
Failure to hold above 1.3150 could see the market testing the 1.3100 region, with support likely coming near the 1.3232 restrictive mark, the November trough of 1.3114, and then around the 1.3100 round-level.
In brief, USDCAD is searching for a rebound, though negative trend signals seem to be strengthening, reducing optimism for a meaningful rally.

