USDJPY’s further gains seem to be restricted by the 200-day simple moving average (SMA) and the upper Bollinger band around the 109.00 resistance level. Yet, the upward sloping mid-Bollinger band and 40-day SMA back an improving picture.
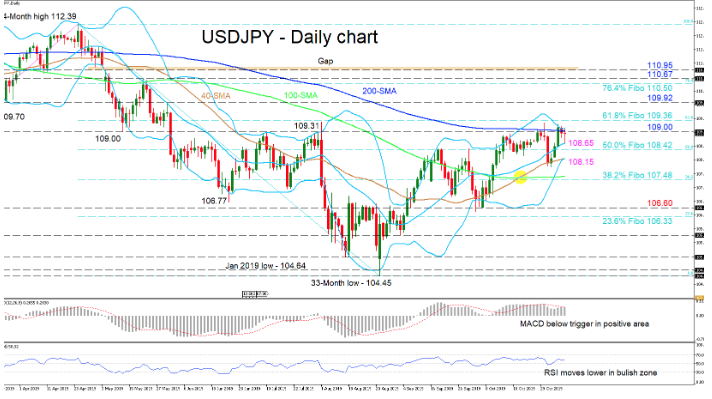
Despite this, the 200- and 100-day SMAs have moved horizontal, implying that a sideways move may endure. Furthermore, the technical indicators suggest that positive momentum has weakened, something also reflected in the squeezing of the Bollinger bands. The MACD is in the positive region but slightly below its red trigger line, while the RSI is hovering midway in bullish territory.
On the way up, the initial durable resistances around the 109.00 level could limit the ascent towards the key level of 109.36 – which is the 61.8% Fibonacci retracement of the down leg from 112.39 to 104.45 – located barely above the swing peak of August 1. Overcoming this, the pair could meet the 109.92 high from May 30 and, while climbing higher, confront the 76.4% Fibo of 110.50 ahead of the swing peak of 110.67 from May 21.
If selling interest picks up, the mid-Bollinger band at 108.65 could be first to hinder the drop to the neighboring 50.0% Fibo of 108.42 before the 108.15 support level is confronted, which is the point where the 40-day SMA and lower band have merged. Surpassing this would reel in the 100-day SMA near the 38.2% Fibo of 107.48.
Overall, the short-term bias remains neutral-to-bullish and a break above 109.36 would confirm a bullish bias in the short- and medium-term. However, a move below 106.60 could rekindle the negative picture.

