USDJPY has moved sideways along the recently breached 108.42 level, which is the 50.0% Fibonacci retracement of the down leg from 112.39 to 104.45. Bound between 109.00 and 108.42, the positive picture seems to be holding for now.
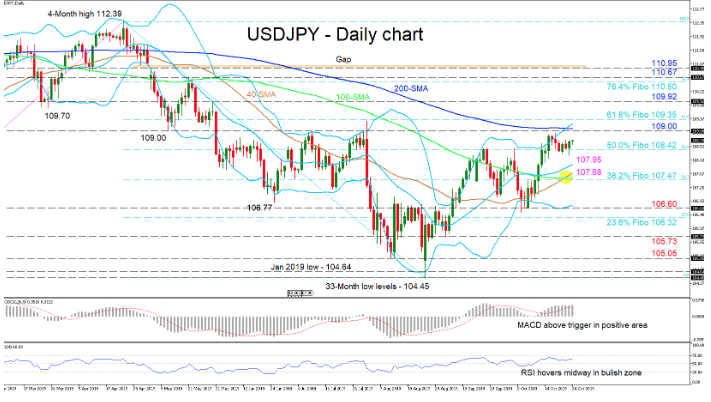
With the pause in the market, the MACD has eased, but remains slightly above its red trigger line in the positive region, while the RSI hovers midway in bullish territory – both promoting an improving picture. Moreover, the bullish crossover of the 100-day simple moving average (SMA) by the 50-day one and the upward slopes in the mid Bollinger band and 50-day SMA boost the positive view.
If the bulls manage to move higher, they initially face a key resistance region from the resistance of 109.00 to the 61.8% Fibo of 109.35, which also encapsulates the 200-day SMA and the upper Bollinger band. Overcoming this area, the price could test the 109.92 swing high from May 30, and even higher, another resistance area from 110.50 to 110.67 could attract attention, this being the 76.4% Fibo and the swing peak of May 21.
Alternatively, if sellers breach the 108.42 support, the drop could be interrupted by the mid Bollinger band at 107.95. Next, a more challenging area from 107.68 to 107.47 – the former being the 50-day SMA and the latter the 38.2% Fibo, which also contains the 100-day SMA – could apply significant upside pressure. Surpassing this, the lower Bollinger band around 106.60 could be next to test the bears.
Summarizing, the short-term bias is neutral-to-bullish. A break above 109.35 would cement the bullish bias in the short- and medium-term, while a break below 106.32 could revive the negative sentiment.

