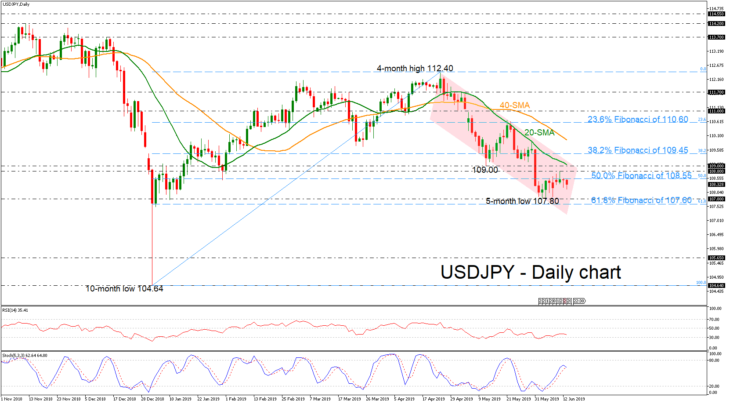
USDJPY has been on the sidelines for the most part of the week as the 109.00 level seems to be a real obstacle for the bulls. Over the last seven weeks the pair has been developing in a descending channel, erasing the bullish retracement from the 104.64 support.

Technically, the price could lose some ground in the short-term as the RSI is moving downwards in the negative area, while the stochastic is creating a bearish cross within the %K and %D lines.
A continuation of the rebound from the five-month low, could meet strong resistance between 108.80 and 109.00, where the 20-day simple moving average (SMA) is located. Exiting the channel, the 38.2% Fibonacci of the upleg from 104.64 to 112.40 near 109.45 could halt further advances.
Alternatively, a decline under five-month low (107.80) should keep the pair in a bearish mode, challenging the immediate support of the 61.8% Fibonacci region of 107.60. A strong rally below this line could open the way towards the 105.65 hurdle, identified by the low on January 2018.
In the short-term picture, USDJPY is gently pointing down after the bounce off the four-month high of 112.40. Only an upside run above the aforementioned obstacle could turn the bias back to bullish. Otherwise traders will most likely look for negative movements.


 SP500
SP500 FTSE
FTSE FCE
FCE Nasdaq100
 Russell2000
 Index Nikkei225
 DOW 30 (DJI)
 RTS futures
 RTSI
RTSI DAX30
DAX30 eBay Inc.
 Google Inc.
 IBM Corp.
 Microsoft
  Apple
Apple Yandex
 Toyota
 Volkswagen
 Facebook
 Tesla
Tesla Twitter
 Hasbro
 Bitcoin
 Litecoin
 BitcoinCash
 Dash
Dash Ripple
 Ethereum
 EmerCoin
 NameCoin
 PeerCoin
 Monero
 ETC/USD
 Silver
 Platinum
 Palladium
 Copper
 Gold
Gold