USDJPY remains stuck in a bearish phase as the momentum oscillators struggle in negative territory. The RSI is trending downwards below the 50 level, while the MACD histogram is heading back down below 0, though it’s holding above its red signal line for now.
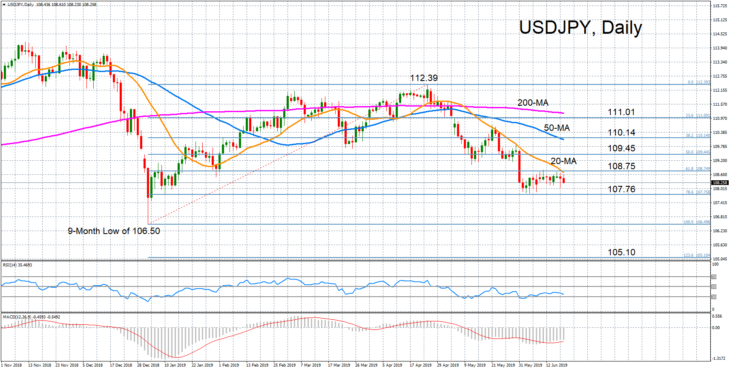
Prices are currently being capped by the 108.75 level, which is the 61.8% Fibonacci retracement of the upleg from 106.50 to 112.39. The 20-day moving average also lies in that region, suggesting this could prove a difficult resistance point to overcome. Should the pair manage to break above this area, the short-term bias would shift to a more neutral one and open the path for the 50% Fibonacci at 109.45. However, prices would need to climb as high as the 50-day moving average just above the 110 handle for the near-term picture to turn bullish again.
On the downside, critical support is being provided by the 78.6% Fibonacci at 107.76. A breach of this support would clear the way for the 9-month low of 106.50 reached in January and reinforce the bearish structure in the medium term. Even sharper losses would bring into range the 123.6% Fibonacci extension at 105.10.

