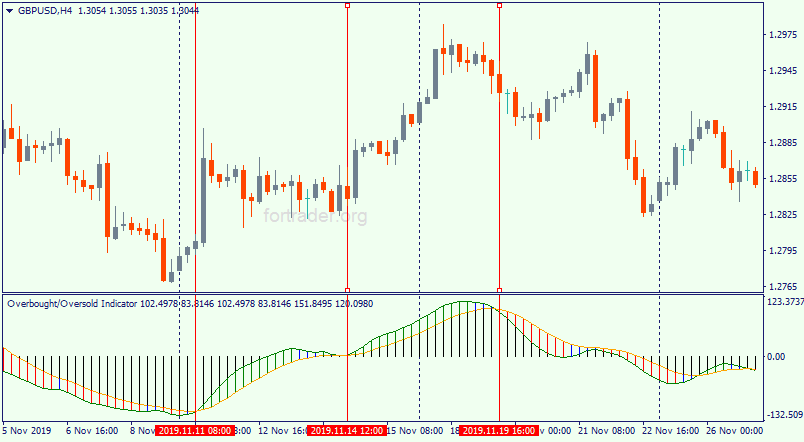

Forex indicator OBOS (overbought and oversold) of overbought and oversold displays respective market condition. It is important to pay attention on the current color of the histograms: green means uptrend, orange – downtrend. Crossing of the lines provides delayed signal, so the indicator is more for info.
Formulas of OBOS indicator:
Up = EMA (EMA ((WP-EMA (WP)) / StdDev (WP))),
Dn = EMA (Up), where
EMA – exponential moving average with the period [Length],
StdDev – standard deviation with the period [Length]
WP – weighted price ((high + low + close + close) / 4).
Further development of the indicator for STI system – added BB channel and arrows on the chart are displayed if the intersection of the curvil indicator occurs outside of the channel. If the crossing happened insede the channel, the arrows are not placed.

