One of the most foundational aspects of technical analysis in Forex trading is support and resistance levels. These levels are key as they offer traders obvious places to limit and define their risk. There also represent places that price should not go if a trader has correctly analyzed their trade.
These places are defined by support and resistance levels. Once a trader has decided which currency pair is suitable for trading the next decision is where and how to make your entry. This article will consider three key areas of Support and Resistance that traders use as part of their technical analysis in order to make that decision.
Horizontal Support and Resistance
Arguably the most widely followed aspect of technical analysis is horizontal support and resistance levels. Horizontal support and resistance levels are key market levels where price has shown reaction in the past.
As price moves towards those levels, at which price has reacted previously, they become significant as points in the market dividing buyers and sellers. Think of these levels as ‘zones’ rather than ‘lines’. You might find it helpful to think of these zones like a fat man’s stomach.
You can push in quite a bit into a fat man’s stomach before you reach the point you can’t push anymore. In a similar way horizontal support and resistance levels provide a general zone or area where price will react.
Some traders go wrong when they consider these levels as only being in play at a specific level. They are not to be viewed as exact levels. Sometimes price will appear to stop short 10 pips before the level. Other times price will overshot the level by 20 pips before finally respecting it.
They are not strict levels, but rather key zones. The general rule of thumb in using these levels is to buy from support (with stops the other side of the level) and sell from resistance (with stops the other side of the level). These levels are also good places in order to take profits as price will often reverse at key horizontal support or resistance levels, if only to retrace before continuing the move, so taking partial profit or moving positions to break even makes sense.
Moving averages
Another basic and common place to find support and resistance is with moving averages. Now moving averages are slightly different to horizontal and support levels as they can, at times, be respected quite accurately.
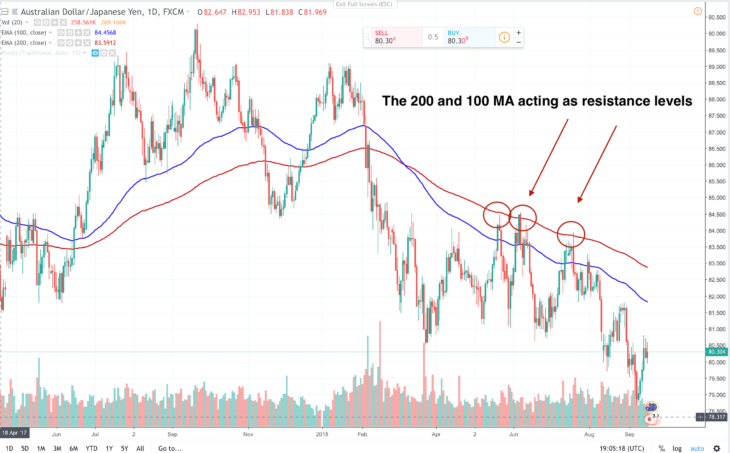
Although there will be occasions where the moving averages try to break through their levels, often the closing price will demonstrate whether the buyers or sellers have won that battle or not. Two of the most popular moving averages are the 100 and 200MA. By using these two moving averages traders can find excellent places to limit and define risk.
Looking at the AUDJPY currency pair below you can see the 100 and 200 MA acting as resistance levels on the daily chart as the AUDJPY pair was in a down trend. Risk off sentiment and US China trade war rumblings led to a AUDJPY short bias. The Moving averages provided places for traders to define and limit their risk to take advantage of short trades.
https://fortraders.org/en/forex-indicators/st-trend-indicator-no-repaint.html
Pivot points
Pivot points are very similar to support and resistance levels since they are horizontal levels in the market which are viewed by lots and lots of traders. In a similar way that Fibonacci levels are respected in the market because many traders are looking at them, pivot points are widely followed levels too.
Part of their widespread appeal is that they are calculated in an objective way, so there is no uncertainty about where they should or shouldn’t be. A pivot point is formulated as an average of important prices (high, low, close) from the previous trading period.
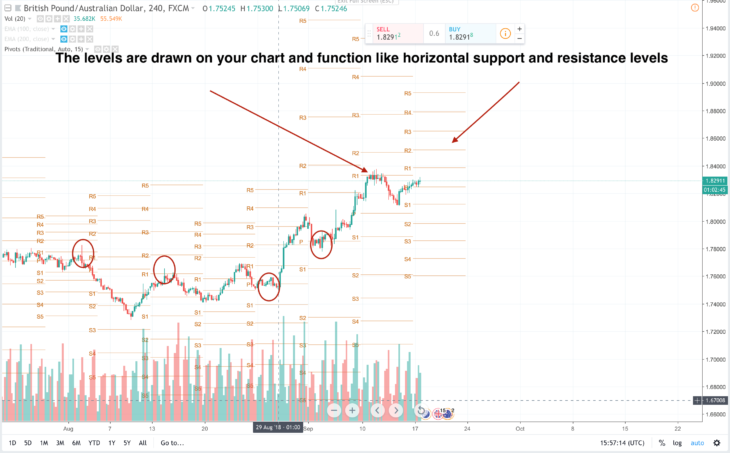
You don’t have to calculate the pivot point levels themselves since most charting software will do it for you. You can also install indicators that automatically chart the levels on the chart. The way to use them is to find a currency pair that you think should fundamentally move in price. So, for the sake of this illustration, let’s suppose you have decided that you want to try and swing trade the GBP/AUD pair long.
You would then look to buy from either the pivot point or a support level labelled S1, S2, or S3. Have a look at the chart below to see the pivot points labelled on the GBPAUD currency pair.
The key concept to understand regarding support and resistance levels is that they are primarily used by traders to define and limit their risk. It is not advisable to just use technical analysis on its own since the market is driven mainly by sentiment and fundamental analysis.
However, when there is a combination of fundamental reasons for entering a trade and a technical place to define and limit risk then this can make for some successful trades. So, this article has shown you three key basic areas where you can find support and resistance levels in Forex trading: at moving averages, horizontal support and resistance levels and pivot points. Take them and consider using them as part of your technical analysis toolbox.

