Greetings!
If you’re a new trader and you’re using technical analysis to analyze price action then you’ll probably start by studying price levels.
The words ‘price levels’ is seen in most articles that use technical analysis. What exactly are ‘price levels’ and are they important when forming a trading strategy? Let’s take a closer look.
Types of the levels
When we start trading on the financial market, we are surrounded by different market players, big and small, who adhere to a specific trading strategy. Some strategies are more successful than others, but one of the postulates of technical analysis is that the market is logical or consequent. This means that at certain times, the majority of market players will act the same. Knowing when these moments and possible actions by other market players are, we join the stream and float along until the trend changes.
These moments, is what we call price levels. Most commonly known price levels are areas of support and resistance.
The support line is a price level where there is an increase in demand and a decrease in supply of a given asset. This leads to the fact, that when the price reaches this level it reverses and starts to rise. As if it is being pushed away from an invisible boundary.
The level of resistance, on the contrary, is characterized by a decrease in demand and an increase in supply for an asset, which leads to a short-term price decline.
In essence these levels form a price channel within which the price moves. By identifying these price levels and forming a price channel, when the price approaches one of the two boundaries it is possible to predict further price movement with high probability.
Important factors
Here we should note an important factor when working with price levels and price channels. The thing is that most trading platforms allow you to place an order to Buy or Sell an asset when it reaches a certain price level in the future.
For example, if a trader doesn’t want to sit in front of the monitor all day waiting for the best entry or exit point, all they have to do is enter the appropriate parameters for the order, such as designate the price level at which the system is to close or open the trade.
By analyzing the market, a trader knows to Buy at price level of support and Sell at Resistance, consequently entering these parameters into the system.
Now, when the price reaches these levels set by the trader, the system is triggered, which artificially creates a decrease or increase in the price movement. So, who exactly are we buying from or selling to at these areas of support and resistance? After all we are all looking at the same chart. Here we have to remember that although we are all looking at the same asset, we are not all looking at the same chart. The period of analysis changes the picture significantly and by changing to different time frames there will always be someone who will act differently from you because they analyze a different time period and consider the opposite trade from yours profitable.
There is another important attribute to support and resistance levels. When the price breaks or pierces this level means that the trend is either strengthening or changing direction. In order to minimize risks and losses, traders often place their Stop Loss Orders slightly above the level of resistance or slightly below level of support.
A price ‘break out’ often means that a certain price level has been reached and Stop Loss orders have been triggered which intensifies the price movement in the direction of the break. Sometimes there is a situation on the market where bulls and bears attack each other when they suspect a large volume of Stop Loss order in a specific area. If the attack is successful, traders are able to get good profit on price action. Since they are the attackers who initiated a new trend, they were able to get in on the best price possible. But the risks are high as well, because if the attack fails, the reverse movement is likely to close the position of even the most persistent trader.
Unsuccessful attacks can lead to false breakouts. This means that the price breaks the level of support or resistance and then returns back into the price channel. A false breakout is one of the most cunning traps on the market because it leads to incorrect interpretation by traders and as a consequence to losses when opening a position in the opposite direction.
There are different ways to plot your support and resistance levels and, in this article, we will go over a few of those methods. But before we start let’s go over the general rules for building support and resistance.
- Support and resistance levels should be built so that the tops or bottoms of the price movement touches this line. This could be the shadow of the candlestick or the body of the candlestick.
- The more price touches the line has the more reliable it is.
- The less false breakouts the line has the better.
- A breakout is considered when the price closes and there is 2/3 of candlestick body beyond the level.
So, to form a proper level of support or resistance, we have to get the maximum amount of price touches with minimal false breakouts.
In this article we are discussing the graphical methods of level construction and in the next we will talk about the mathematical method of construction.
Horizontal Lines
This is perhaps one of the easiest tools that beginner traders use. And this is a great method especially considering that there are more and more new traders every day and they are very likely to be using the same analysis using simple horizontal support and resistance. Obeying the wishes of the crowd, the price can indeed be in a given range for a certain time. In addition to that, there is a psychological factor, namely the human tendency to round off values. Therefore, horizontal support and resistance is often located at rounded price values.
In order to build levels, we need to first identify a time period for which we will analyze the pair.
Let’s try to analyze AUD/CAD for the period of 05.08.19-05.09.2019. Now we draw two lines that are parallel to each other and perpendicular to the price axis. We can see that the support level is approximately at the value of 0.891946, the resistance level is at 0.904874.
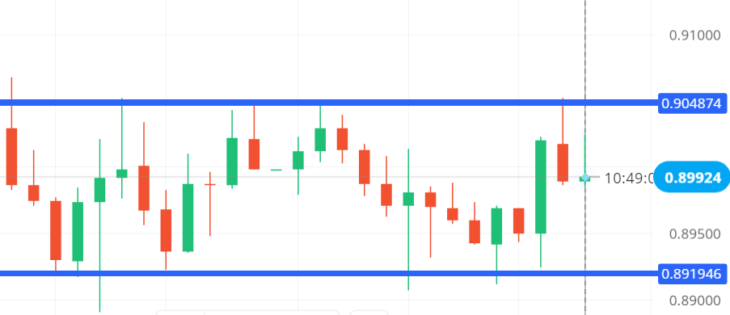
Here we can see, that the level of resistance (top line) is set accurately. The extremums, or tops of the prices are all at about the same level with the line. On the other hand, the support level (bottom line) has almost as many false breakouts as price touches, and therefore this level is not as reliable.
Slanted Support and Resistance Trend Lines
This is another graphic method for constructing support and resistance. This method is more attractive in terms of determining the exact price levels. In this case, first we need to visually determine the direction of the trend and then apply parallel slanted lines. The price will move along this channel with the direction of the trend.
Let’s look at it again on AUD/CAD, on a 1-day time frame for the period of 17.04.2019 – 05.09.2019. The picture looks a bit different, and now when we analyze the price movement from the beginning of the trend change, we can see that the support and resistance levels are constantly shifting down.
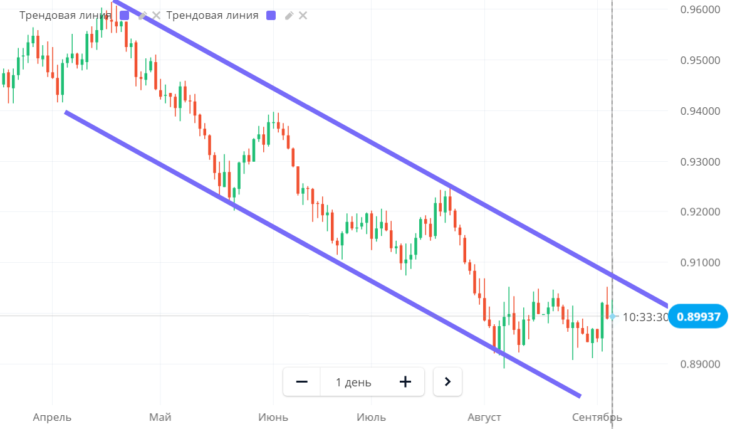
Trades are opened at the level of resistance or support in the direction of the trend. Remember! The trend is your friend.
So, in this article we’ve covered how to properly build support and resistance levels using the graphical method. In our next article we will talk about indicators that are used to determine support and resistance.

