On Monday, February 17th. Brent is consolidating without any particular direction. The instrument is trading at 57.33 USD with the last week’s low being at 53.11 USD.
The latest report from Baker Hughes showed that the Oil Rig Count added 2 units making the total number 678. The Gas Rig Count lost 1 unit, down to 110. The total Rig Count now is 790 units. We remind you that the indicator has been slowly falling throughout 2019 and lost 24.3%.
Before that, there was a report on the Crude Oil Stocks Change and the Gasoline Stocks Change, which showed 7.6M and -0.09M barrels respectively. At the same time, the extraction remained at 13B bpd, which is quite close to the all-time highs.
Market players are still closely watching the coronavirus story and trying to assess its influence on global economies and demand for energy commodities now and in the future. This may limit the price growth potential later.
Brent on charts
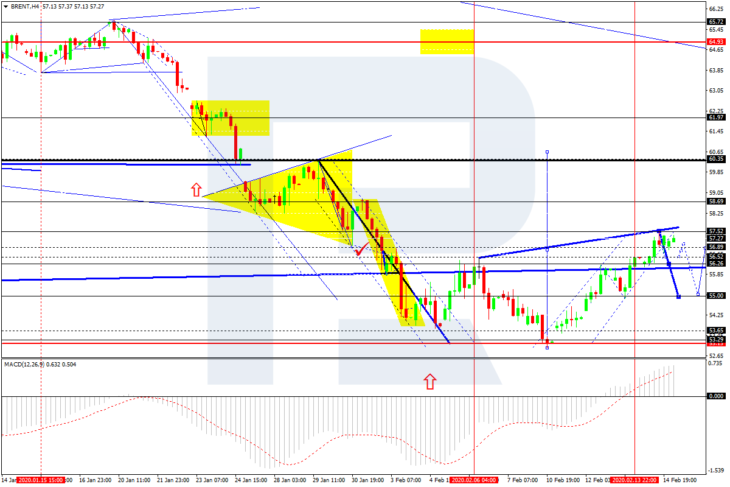
As we can see in the H4 chart, Brent has reached the predicted upside target at 57.50; right now, it is consolidating near the highs. Possibly, the pair may break the rising channel and start a new correction towards 55.00. After that, the uptrend may resume with the short-term upside target at 58.70. From the technical point of view, this scenario is confirmed by MACD Oscillator: its signal line is moving close to the highs; it may soon leave the histogram area and fall towards 0. After the line breaks 0 to the downside, the price may boost its descending movement.
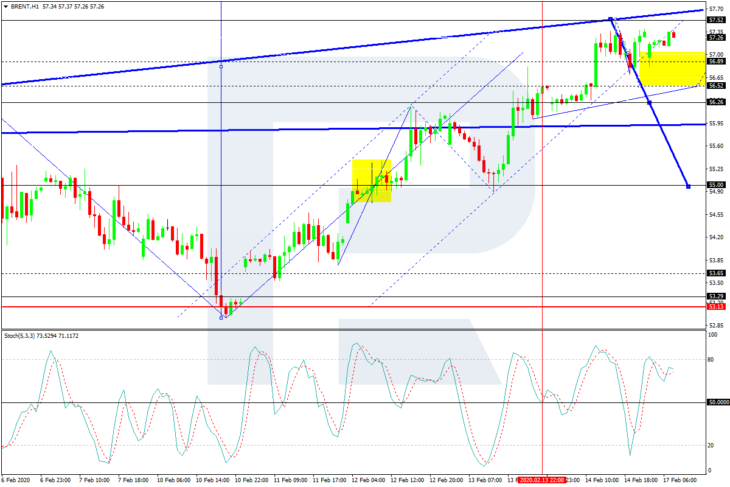
In the H1 chart, Brent is forming the first descending impulse with the first target at 56.52. The main scenario implies that the pair may reach it and then form another rising structure towards 56.90, thus forming another consolidation range. If later the price breaks this range to the downside, the instrument may continue the correction to the downside with the target at 55.60. From the technical point of view, this scenario is confirmed by Stochastic Oscillator: its signal line is moving near 80, thus implying that the price growth may be over soon. Later, the indicator is expected to fall to break 50 and then continue its decline towards 20.

