On Monday, January 27th, Oil is down in the dumps. Active transmission of the “2019-nCoV” virus really affects the commodity market and it keeps getting worse.
Right now, Brent is trading at 58.56 USD and might as well continue plunging while investors are clouded by uncertainty and fears.
The influence can be observed in the following way: the virus outbreak may limit the demand for raw materials and disbalance markets for a while. Moreover, if the virus takes hold in the Asian region, it will surely hurt the consumer spending the way it did during the severe acute respiratory syndrome outbreak several years ago. In this case, the GDPs of Asian countries will suffer additional fluctuations.
Another negative catalyst is Brazil’s rejection to enter the OPEC. The country has other priorities, such as increasing output and production of both oil and gas, and making the top 5 of oil sector leaders. It means that the supply from this country will continue going up, which is rather negative for oil prices.
Brent in charts
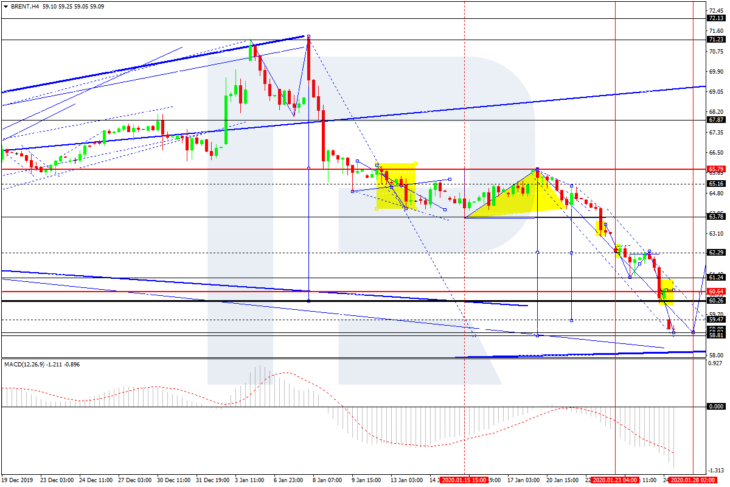
As we can see in the H4 chart, Brent has reached the predicted downside target at 60.30; right now, it is still moving downwards. Possibly, the pair may extend this descending wave down to 58.90 and then start a new correction towards 62.20. After that, the instrument may form one more descending structure to reach 58.80 and complete this descending wave. Later, the market may resume growing with the first target at 65.80. From the technical point of view, this scenario is confirmed by MACD Oscillator: its signal line is moving below 0 inside the histogram area, thus indicating a further decline. After the line breaks the area, the indicator is expected to resume moving upwards to reach 0.
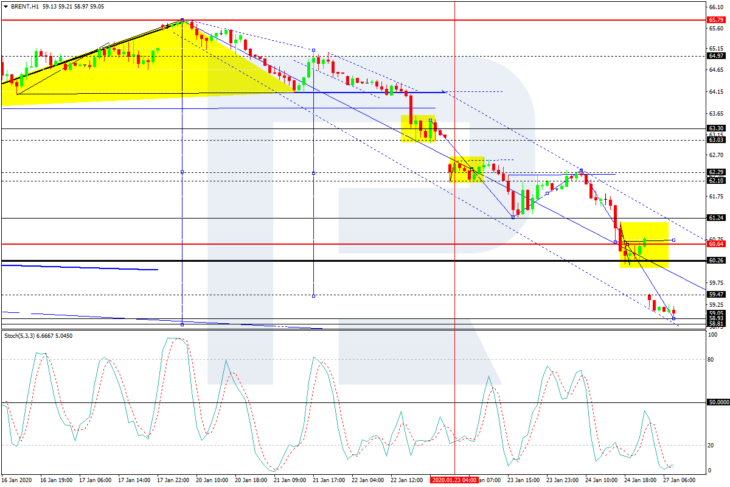
In the H1 chart, Brent is falling towards 58.90. After reaching this level, the pair may start a new correction with the first target at 60.60. From the technical point of view, this scenario is confirmed by Stochastic Oscillator: its signal line is moving below 20. The line is about to reverse and break this level to the upside to reach 50, thus indicating a new correctional uptrend.

