On Monday, March 2nd, the major currency pair continues growing; it has updated its monthly high at 1.1074, thus completely eliminating February losses. Right now, it is moving at the highest levels since February 2nd.
Market expectations of the US rate cut in the nearest future were against the American currency. Investors are always afraid of what they don’t understand quite well, but signals that came from the US Federal Reserve System itself were rather mixed. For example, last Friday the regulator’s representatives said that it was too early to assess the influence of the Chinese coronavirus issue on the US monetary policy.
At the same time, market expectations of another rate cut in March are slowly increasing. According to global estimations, there might be one rate cut by April and three – by March 2021.
There will be a lot of important numbers for EUR/USD throughout the week. However, the ones that usually attract the most attention will be published on Friday: the Unemployment Claims, the Non-Farm Employment Change, the Unemployment Rate, and the Average Hourly Earnings. These reports have a very significant influence.
EUR/USD on charts
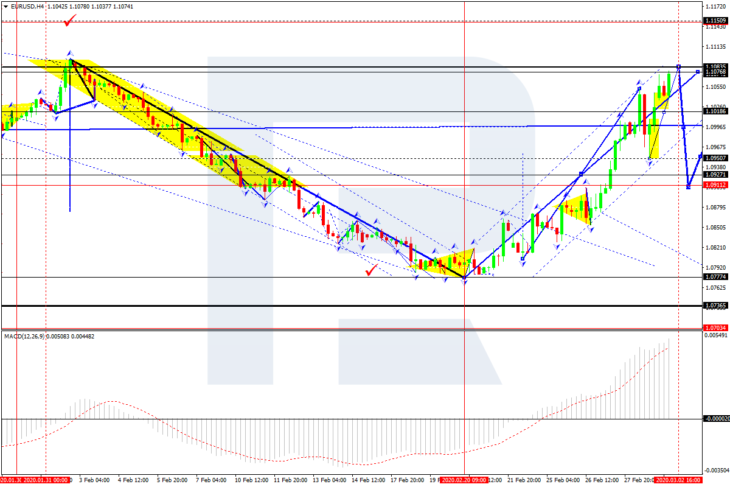
In the H4 chart, EUR/USD is moving upwards; this growth may be considered as the fourth wave inside the downtrend. Possibly, today the pair may reach 1.1083 and then form a reversal pattern for the fifth descending wave towards 1.0737. The first predicted target is at 1.0911. From the technical point of view, this scenario is confirmed by MACD Oscillator: its signal line is moving near the highs and may leave the histogram area soon. The line is expected to leave the area and then fall to break 0. After that, the instrument may boost its decline on the price chart.
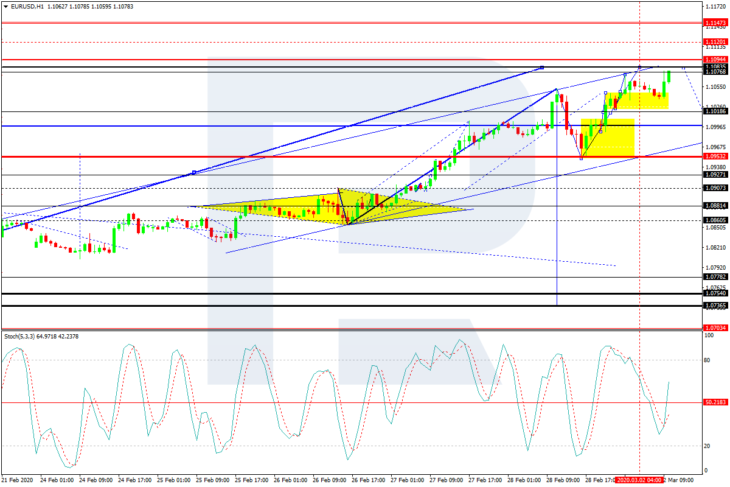
As we can see in the H1 chart, after forming a narrow consolidation range around 1.1038, EUR/USD has broken it to the upside and may reach 1.1083. Later, the market may fall to break 1.1000 and then continue its decline with the first predicted target at 1.0900. From the technical point of view, this scenario is confirmed by Stochastic Oscillator: its signal line has broken 80 to the downside thus indicating a new descending wave.

