EURUSD rose as high as 1.1062 following the breach of the four-month-old downward-sloping line but the technical indicators signaled overbought conditions, with the price correcting slightly lower and towards the key 1.1025 barrier.
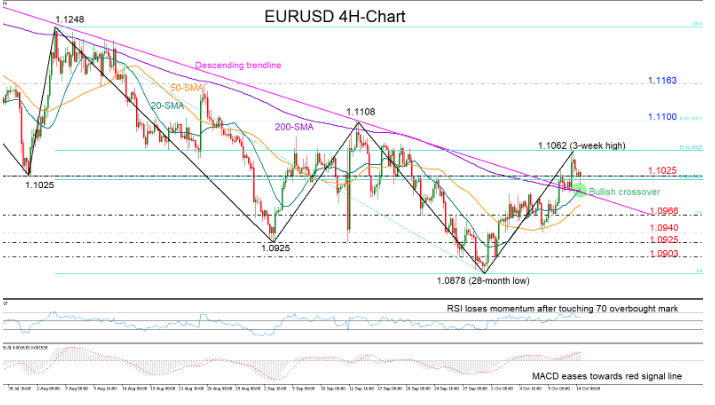
The short-term bias is looking bullish to neutral in the four-hour chart as the RSI is heading towards its 50 neutral mark and the MACD is losing momentum towards its red signal line.
In terms of market trend, the bullish crossover between the 20- and the 200-period simple moving averages (SMA) is an encouraging indication that the upward direction may hold, though a higher high above 1.1108 and a higher low above 1.0878 is technically required to officially violate the downtrend started at the end of June.
A rally above the 1.1062 peak, where the 50% Fibonacci of the downleg from 1.1248 to 1.0878 lies, could help the price to reach the 1.1100 mark and the 61.8% Fibonacci. If buying interest persists above the latter, resistance could then appear somewhere near the 1.1163 barrier.
Alternatively, if the bears keep control under 1.1025, the price could find support around the 200-period SMA which currently touches the downward-sloping line at 1.1000. Further down, the sell-off may stop around the 23.6% Fibonacci of 1.0999 that offered some underpinning last week, while lower, the area between 1.0940 and 1.0925 could prove a stronger obstacle before all attention turns to 1.0900.
In brief, positive momentum in EURUSD may weaken in the short-term, while regarding the market trend, the pair has yet to confirm that bullish trend signals are viable.

