GBPUSD has been advancing over the last five days, following the rebound on the six-month low of 1.2500. Currently, the price is finding strong resistance near the 40-day simple moving average (SMA), which overlaps with the 1.2770 barrier.
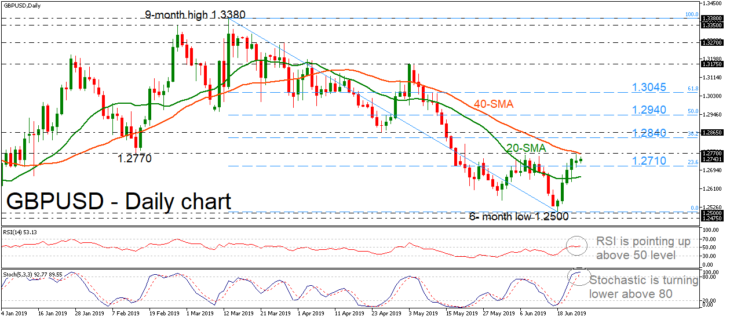
Looking at the technical indicators the stochastic seems to be overstretched as it is turning lower above the 80 level. However, the RSI is pointing slightly up while in the positive territory, suggesting more gains in the near term.
If the price continues the strong bullish movement and surpasses the 40-SMA, it could find immediate resistance at the 38.2% Fibonacci retracement level of the downleg from 1.3380 to 1.2500 near 1.2840, before touching the 1.2865 barrier. Even higher, the 50.0% Fibonacci of 1.2940 could provide resistance as well.
On the other side, if the pair retreats and slips beneath the 23.6% Fibonacci region of 1.2710, it could meet support at the 1.2660 level. More losses could drive cable at the 1.2500 handle and the 1.2475 area, taken from the low on December 2018.
Overall, GBPUSD looks to be bullish in the near term and a daily close above 1.2770 could endorse traders’ bullish positions.
In the long-term picture, the pair has been remaining negative since the downfall from 1.3380.

