GBPUSD has paused its sell-off just above the 200-period simple moving average (SMA) and near three-week lows in the four-hour chart. But the falling Tenkan-sen suggests that the bearish action has more room to run. The RSI is backing this view as well, though it also signals that any downside may appear limited in the short-term as the indicator is not far above its 30 oversold level.
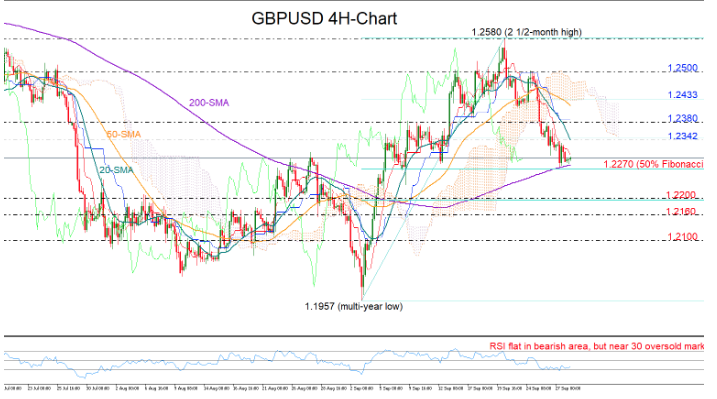
The 1.2270 mark, which is slightly under the 200-period SMA and where the 50% Fibonacci of the upleg from 1.1957 to 1.2580 is placed, could reactivate the bearish wave if significantly breached. In this case support could shift towards the 1.2200 round-level and near the 61.8% Fibonacci, while lower the next key obstacle to watch could be within the 1.2100-1.2160 congested zone.
In the event of an upside reversal, immediate resistance could be found in the crossroads of the 20-period SMA and the 38.2% Fibonacci of 1.2342. Moving higher, the rally may next stall around the 1.2380 barrier before testing the 23.6% Fibonacci and the bottom of the Ichimoku cloud at 1.2433. Yet the latter may not be enough improvement as traders would be waiting for a closing price above the cloud and the 1.2500 number to resume confidence on the uptrend started from the 1.1957 multi-year low.
In the bigger picture the pair is trading within the 1.2578 -1.1957 range and only a violation at these boundaries could determine the future directional bias.
Summarizing, GBPUSD continues to air bearish vibes in the four-hour chart, with the 1.2270 level being the next target on the downside.

