GBPUSD failed several times to jump above the 20-day moving average and the 23.6% Fibonacci retracement level of the downward wave from 1.3380 to 1.2560, near 1.2753, suggesting weak momentum in the daily timeframe.
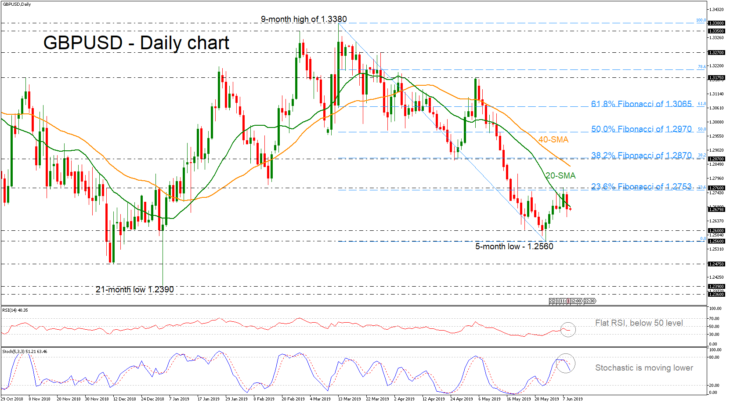
The negative to neutral bias in the near term is supported by the deterioration in the momentum indicators. The %K line of the stochastic oscillator has fallen sharply below the overbought zone, while the RSI indicator is flattening in the negative territory.
The 1.2600 psychological level has proven a reliable support level in previous sessions and therefore should be closely watched in case of negative momentum. Even deeper, a significant decline below the five-month low of 1.2560 would open the way towards the 1.2475 area.
On the flipside, immediate resistance to upside movements could emerge around 1.2753 – 1.2760 and a closing price above them could prove more important for the rally to continue. Even higher, a taller wall could be holding around the 38.2% Fibonacci of 1.2870, but the pair needs to first surpass the 40-day SMA – currently at 1.2840.
Concluding, downside risks have somewhat increased in the short-term as the technical indicators are supporting a bearish to neutral bias, while in the medium-term the bearish outlook remains.

