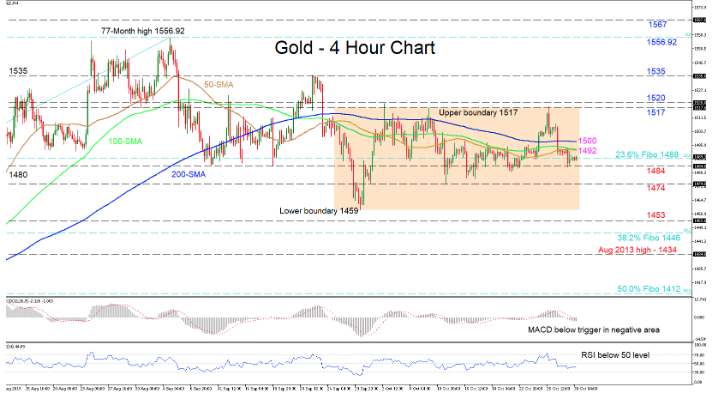
GOLD has stalled around 1488, which is the 23.6% Fibonacci retracement of the up leg from 1266.20 to 1556.92. The precious metal seems to be skewed towards a short-term negative outlook after the price reversed back down from 1517 levels and below the simple moving averages (SMAs) but is expected to remain within its trading range.
The short-term oscillators suggest a pause in the negative directional momentum. The MACD is below its red trigger line in the negative zone, but has eased slightly, while the RSI is hovering midway in the bearish territory, barely pointing upwards. Further backing the neutral picture are the flattened SMAs, although they are reinforcing the odds to the downside, as they are capping the price.
To the downside, the nearby support of 1484 could restrict initial declines as it has been tested multiple times since September. Moving lower, the trough of 1474 coming from October 11 could apply some pressure ahead of the lower boundary of 1459. Surpassing 1459, the neighboring support of 1453 could challenge the bears ahead of the 38.2% Fibo of 1446.
Alternatively, if the buyers manage to push higher, the first obstacle could be a tough one, as it is the flat SMAs around 1492 and the 1500 handle. Overcoming this could see the commodity test the upper boundary region of 1517 – 1520 where the highs of the trading range are located. Further up, the swing peak of 1535 from September 24 could restrict the test of the multi-year high.
Overall, the short-term is neutral, and a break above 1517 or below 1459 would reveal the directional bias.

