Gold has declined considerably over the last couple of trading days after the touch on the almost seven-year peak of 1,611 on January 8. The price entered the Ichimoku cloud and is capped by the bearish crossover within the short-term 20- and 40-period simple moving averages (SMAs), assuming a negative correction.
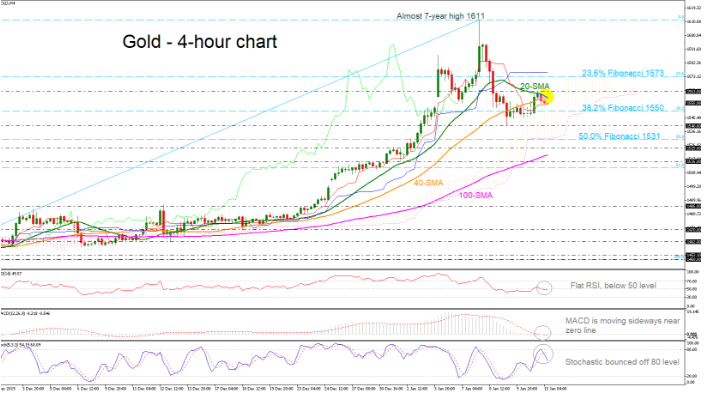
The technical indicators in the 4-hour chart seem to be neutral to bearish. The RSI indicator has just dropped beneath the 50 level with nearly flat momentum, while the MACD oscillator is moving sideways around the zero level. However, the stochastic bounced off the 80 territory and created a negative cross between the %K and %D lines.
Immediate support to further downside pressure may be taking place around the 38.2% Fibonacci retracement level of the upward wave from 1,450 to 1,611, near 1,550 and the 1,540 mark, which could provide additional support in case of steeper losses.
Should the price decisively close above the roof of the 1,563 resistance, the 20-period SMA could move towards the 23.6% Fibo of 1,573. Further advances above this level could then target the area around the seven-year high of 1,611, extending the medium-term uptrend.
All in all, the yellow metal is creating a retracement to the downside, confirmed by the momentum indicators in the near-term.

