Gold prices stopped rising in the second decade of February. On Monday, February 10th, the precious metal is trading at 1575.40 USD right in the middle of the mid-term channel.
At the time when market players were trying to escape risks and switching to “safe haven” assets, Gold was in demand and felt good support. By now, the Chinese coronavirus story hasn’t clarified yet but got much less tense, and that’s a fact. In this light, Gold prices can’t rise as quickly as they did before.
The short-term rising impulse in Gold is held back by some pretty strong numbers on the US labor market. A positive expansion of the NFP and the ADP, as well as a little improvement in the Average Hourly Earnings, indicate that the American employment market is doing great. It’s a good signal for the USD but for Gold – vice-versa.
At the same time, it’s quite clear that in the case of aggravation of the global situation, investors’ demand for Gold will return.
XAU/USD on charts
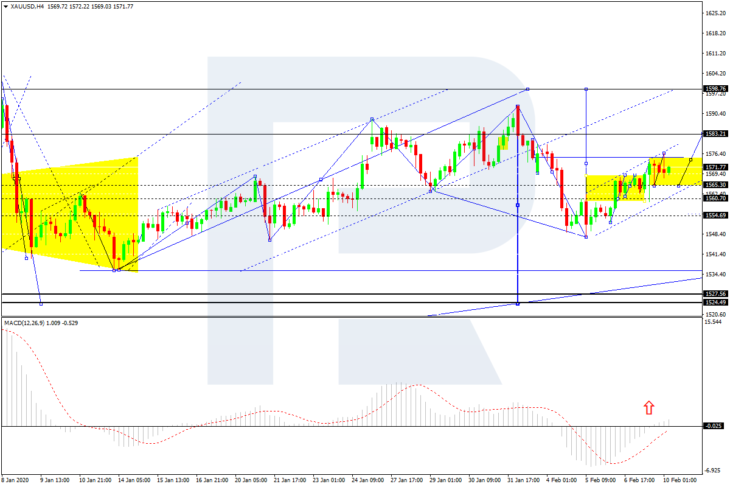
As we can see in the H4 chart, XAU/USD has returned to 1573.00; this entire structure may be considered as a correction of the previous descending wave. Right now, it is consolidating around the above-mentioned level. If later the price breaks this range to the downside along with the rising channel, the market may resume trading downwards to break 1550.00 and then continue the downtrend towards 1525.00. However, if the pair breaks the range to the upside, the instrument may choose an alternative scenario and continue the rising wave to reach 1598.50. and has almost formed Divergent Triangle pattern. After reaching the above-mentioned target, the pair may start a new descending wave towards 1524.50. From the technical point of view, this scenario is confirmed by MACD Oscillator: its signal line is moving close to 0. If the line breaks 0 to the upside, the rising wave will continue.
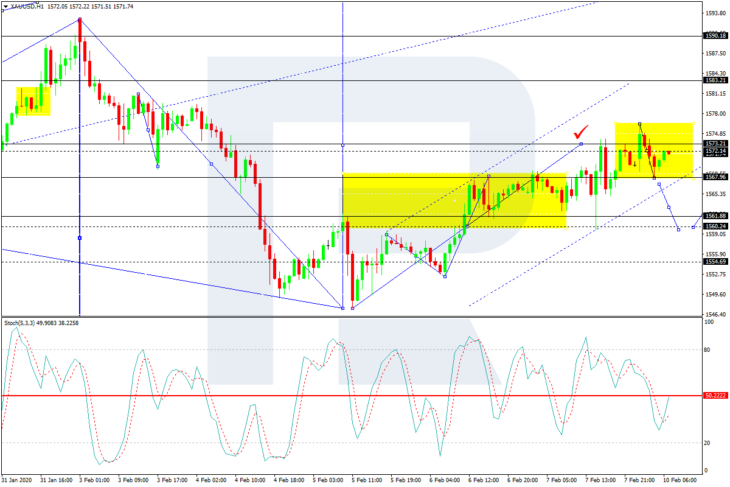
In the H1 chart, after reaching the key target of the ascending wave at 1575.00, XAU/USD has finished the descending impulse towards 1568.00 along with the correction to reach 1572.30. Possibly, today the pair may form a new descending wave to break 1565.00 and then continue falling with the target at 1550.00. From the technical point of view, this scenario is confirmed by Stochastic Oscillator: its signal line is moving below 50 and may continue falling to reach 20.

