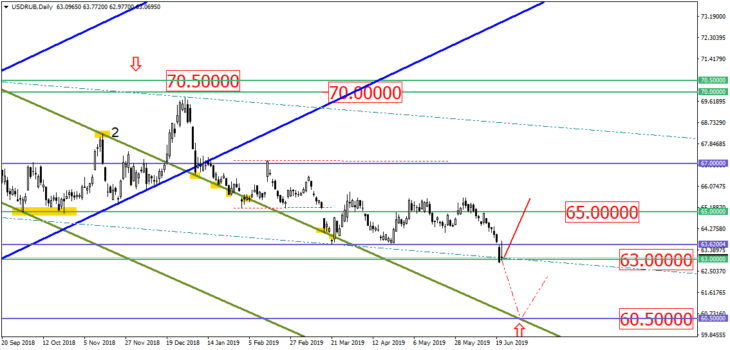
Based on the decision by the FOMC, the USD/RUB approached the 63 level and closed the trading week right there. Now, we could assume that this asset will either pull back from the 63.00 support level or break through it and drop till the 60.50 level. So far, the pullback is potentially more likely. Here we should rely on the candlestick formations that should be visible next week:
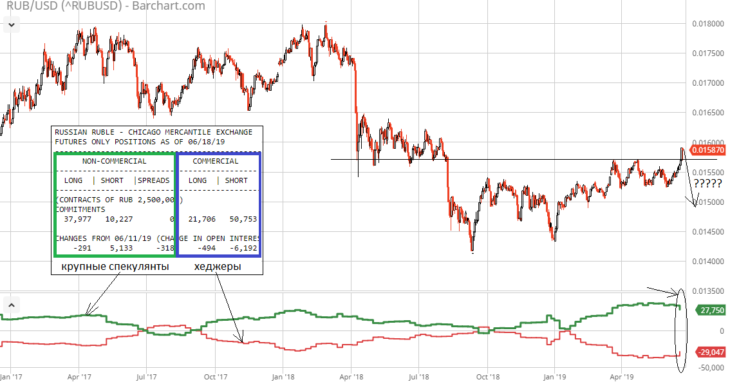
Based on the reports by CОT CFTC, large operators quickly expanded short positions on the Russian ruble, with optimism that there could be a potential jump of the USD/RUB. This matter may indirectly confirm the possible jump of the asset from the 63.00 level. Checking the chart with the positions of large operators, we can see that the trend is gradually reversing downwards:
Hedgers WTI oil is trying to correct itself after its recent drop. However, oil may face resistance in the area between the broken uptrend and the new downtrend. Although the asset’s price may quickly touch the level of 65 dollars per barrel, leaving a fine long spike.
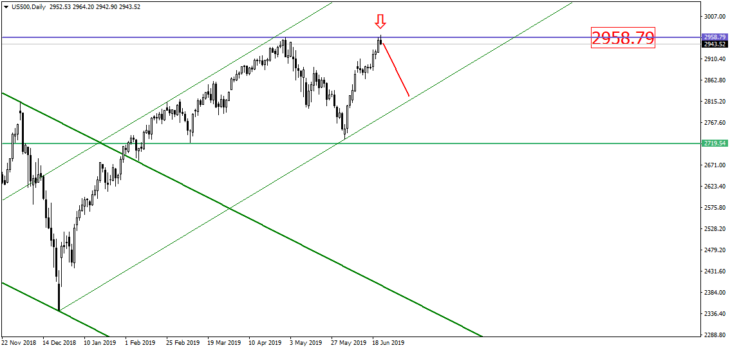
The S&P500 index quickly broke the historical maximum at the 2958.79 level and headed downwards, closing the trading day above the resistance level. So far, it could be assumed that this index should drop: