USDJPY could not reach the 110.00 level last week as the resistance trendline drawn from the October’s peaks blocked the bulls once again and pressed the price back down to the 50% Fibonacci of 108.40 of the upleg from 112.39 to 104.44.
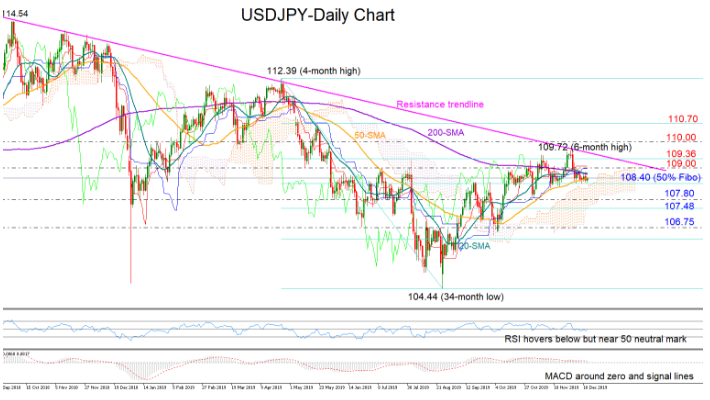
Technically, the pair may lack momentum in the short-term as long as the RSI and the MACD move around their neutral levels and the Ichimoku indicators ( Kijun-sen and Tenkan-sen) keep flattening.
Nevertheless, a closing price below the 50% Fibonacci of 108.40 may increase selling interest probably until the 107.80-107.48 area, where any break lower could next meet support around the 106.75 barrier.
Alternatively, should the bulls return above 109.00, the focus will shift back to the resistance trendline which is currently placed near the 61.8% Fibonacci of 109.36. Running above that block and surpassing the previous 6-month high of 109.72, the door would open for the 110.00 level and then for the 110.70 number.
Meanwhile in the medium-term picture, the pair is trading in an uptrend, printing higher highs and higher lows since the end of August. Traders will be eagerly waiting to see whether the 50-day simple moving average (SMA) can strengthen trend signals by crossing above the 200-day SMA.
In brief, USDJPY may follow a neutral path in the short-term, with the 108.40 and 109.00 levels coming under the spotlight. In the medium term, the positive outlook may turn brighter if the 50- and the 200-day SMAs manage to post a bullish cross.

