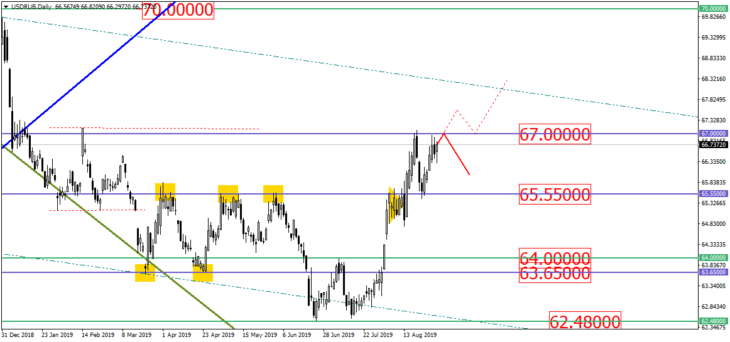
The russian ruble has repeatedly approached the 67.00 level, away from which it can either pull or break it through. Currently, we could rely on the candlestick patterns as the currency pair USDRUB will target the 67.00 level:
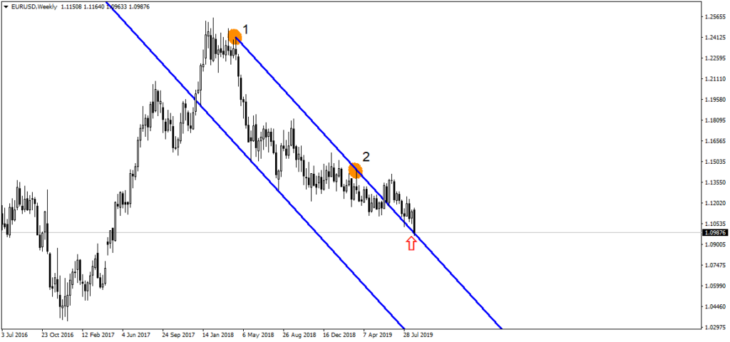
The price of the single currency again approached the broken downtrend located on the weekly time frame:
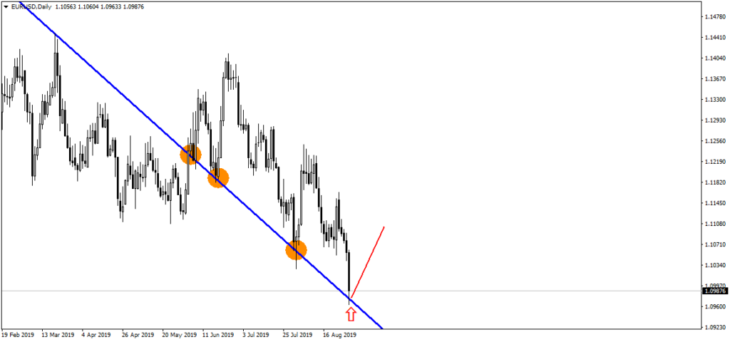
The daily chart clearly shows that the asset’s price approached the broken downtrend for the third time in a row, therefore the EURUSD is likely to pull back up from this downtrend:
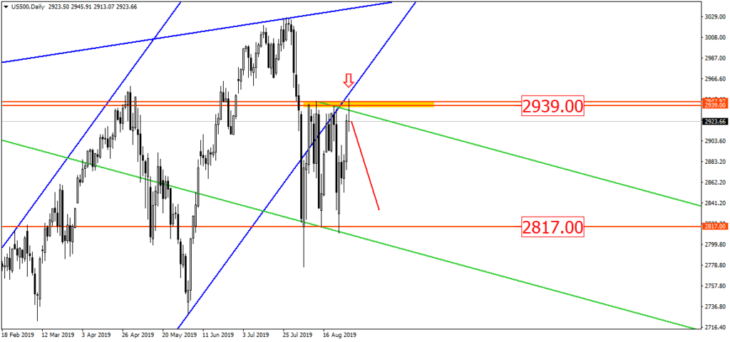
The American stock index, S&P500, has remained between the 2817.00 and 2939.00 levels. Recently the asset’s price has been next to the upper border of this range. At that point, the white candle and the bodiless candle with long shadows have formed the evening doji star. All in all, we could assume that the index could potentially drop to the 2817.00 level:
Let us remind you that this material is provided for informative purposes only and cannot be considered as a direct go ahead to implement transactions in the financial markets. Trading in the financial markets is very risky.

